The Economics of Self-Isolation: A Game-Theoretic Analysis of Contagion in a Free Economy
Table of Links
Abstract and 1. Introduction
-
A free and fair economy: definition, existence and uniqueness
2.1 A free economy
2.2 A free and fair economy
-
Equilibrium existence in a free and fair economy
3.1 A free and fair economy as a strategic form game
3.2 Existence of an equilibrium
-
Equilibrium efficiency in a free and fair economy
-
A free economy with social justice and inclusion
5.1 Equilibrium existence and efficiency in a free economy with social justice
5.2 Choosing a reference point to achieve equilibrium efficiency
-
Some applications
6.1 Teamwork: surplus distribution in a firm
6.2 Contagion and self-enforcing lockdown in a networked economy
6.3 Bias in academic publishing
6.4 Exchange economies
-
Contributions to the closely related literature
-
Conclusion and References
Appendix
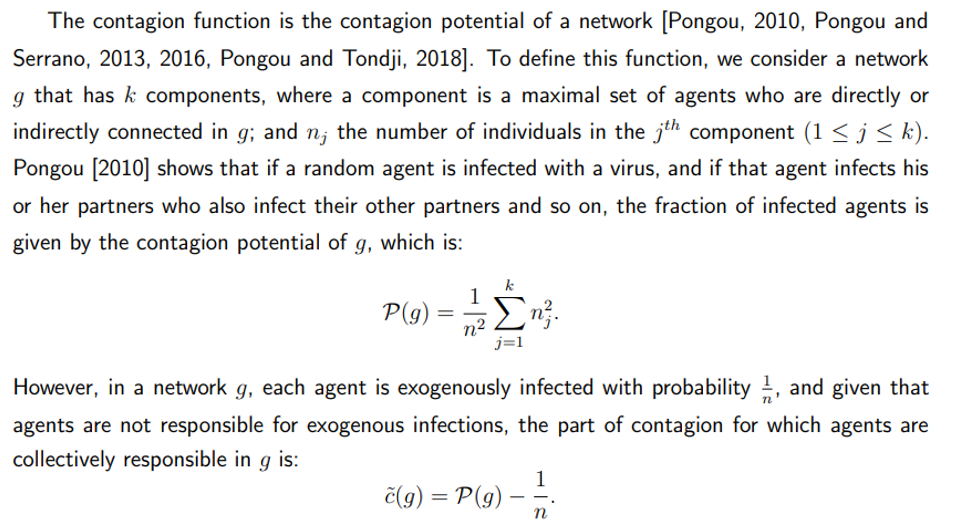
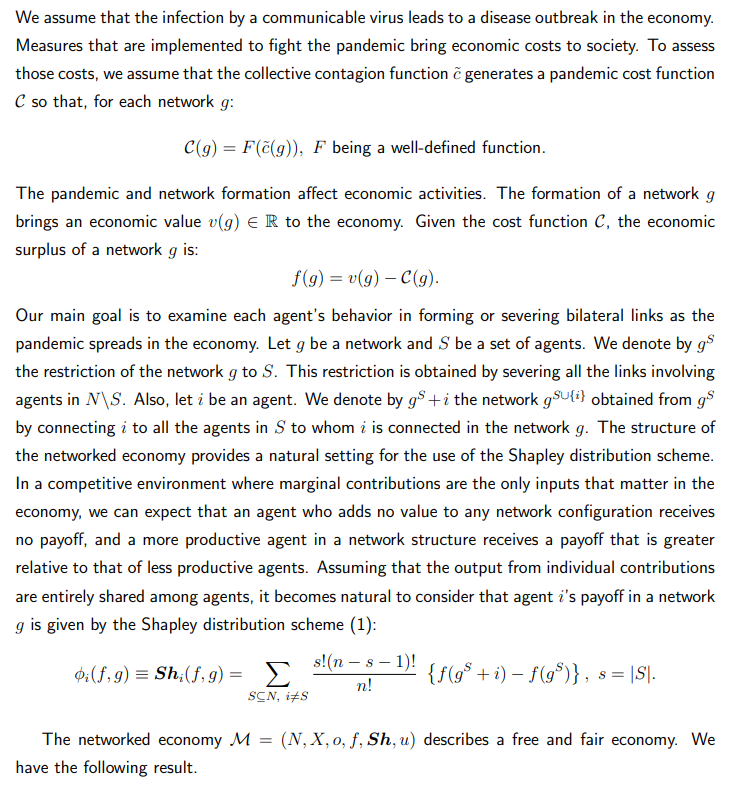
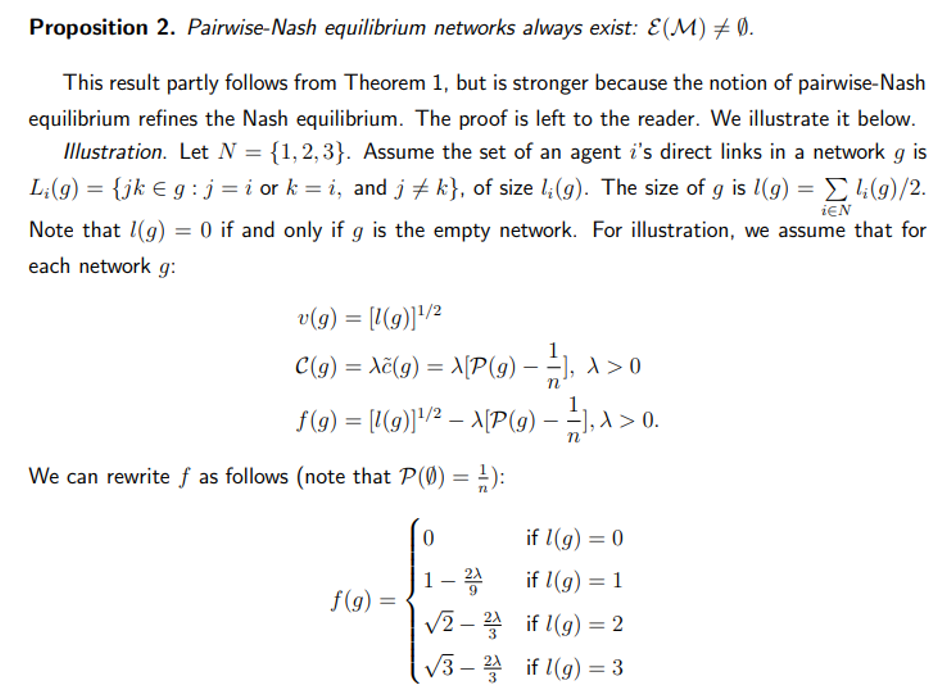
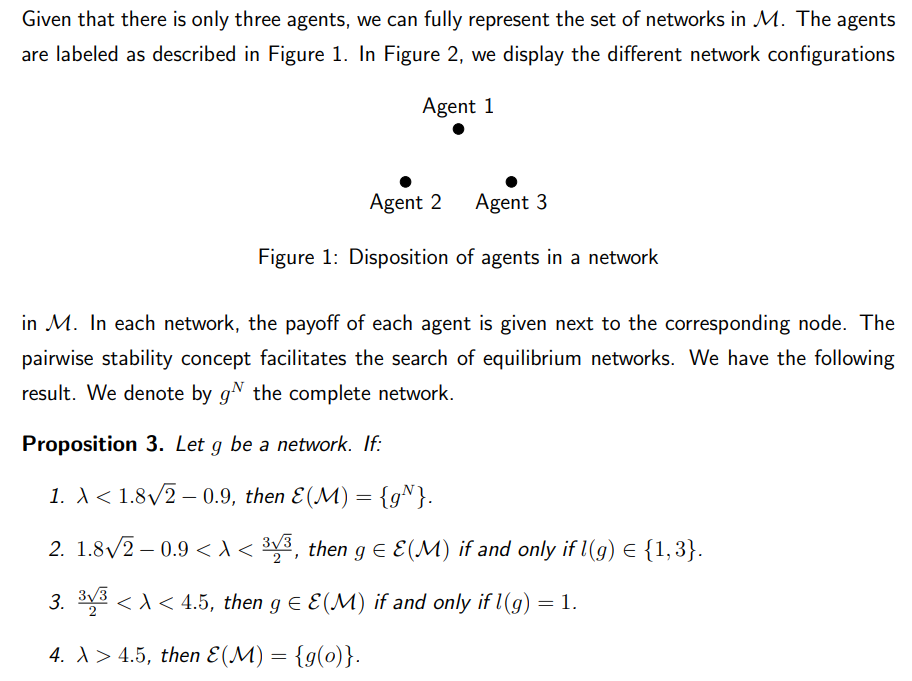
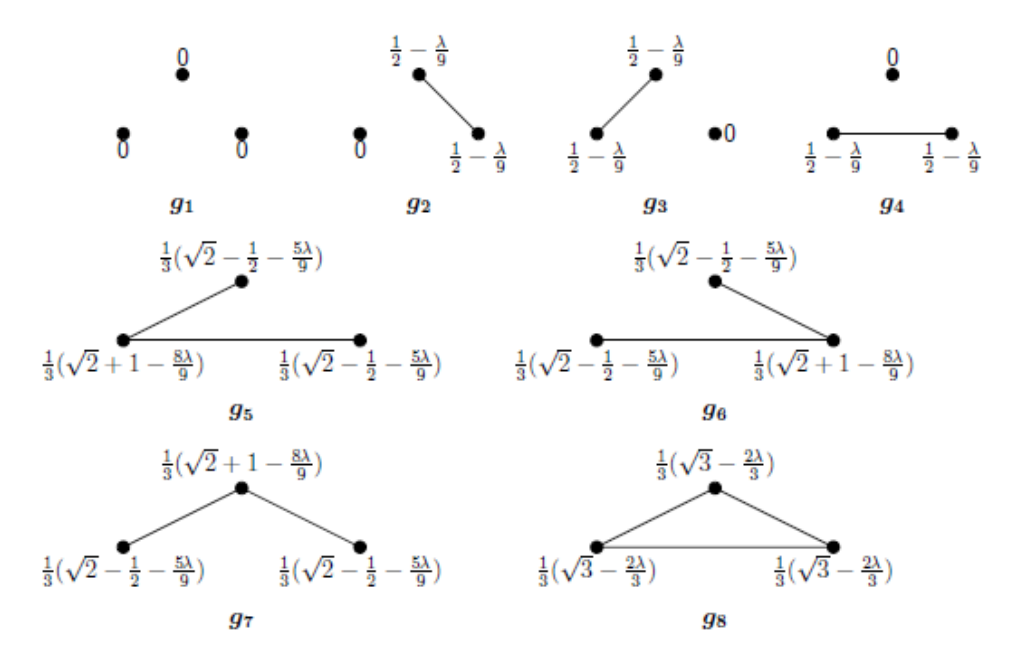
6.2 Contagion and self-enforcing lockdown in a networked economy
In this section, we provide an application of a free and fair economy to contagion and selfenforcing lockdown in a networked economy. We show how the costs of a pandemic from a virus outbreak can affect agents’ decisions to form and sever bilateral relationships in the economy. Specifically, we illustrate this application by using the contagion potential of a network [Pongou, 2010, Pongou and Serrano, 2013, 2016, Pongou and Tondji, 2018].
\ Consider an economy M involving agents who freely form and sever bilateral links according to their preferences. Agents’ choices lead to a network, defined as a set of bilateral links. Assume that rational behavior is captured by a certain equilibrium notion (for example, Nash equilibrium, pairwise-Nash equilibrium, etc.). Such an economy may have multiple equilibria. Denote by E(M) the set of its equilibria. Our main goal is to assess agent’s decisions in response to the spread of a random infection (for example, COVID-19) that might hit the economy. As the pandemic evolves in the economy, will some agents decide to sever existing links and self-isolate themselves? How does network structure depend on the infection cost?
\ 
\ 
\ 
\ 
\ 
\ 
\ 
\ Interestingly, the value of λ depends on the nature of the virus. Viruses induce different severity levels. For example, COVID-19 and the flu virus have different values, inducing different network configurations in equilibrium. The different network configurations in Figure 2 can therefore be interpreted as the networks that will arise in different scenarios regarding the nature of the virus.
\
:::info Authors:
(1) Ghislain H. Demeze-Jouatsa, Center for Mathematical Economics, University of Bielefeld (demeze jouatsa@uni-bielefeld.de);
(2) Roland Pongou, Department of Economics, University of Ottawa (rpongou@uottawa.ca);
(3) Jean-Baptiste Tondji, Department of Economics and Finance, The University of Texas Rio Grande Valley (jeanbaptiste.tondji@utrgv.edu).
:::
:::info This paper is available on arxiv under CC BY 4.0 DEED license.
:::
\


You May Also Like
Trump squandered his second chance —and now he's more dangerous than ever: analysis

Your Bank is Becoming a Casino: River CEO Frames Bitcoin as the Alternative