

Ethereum Price Holds $2K as ETF Flows Signal Demand Shift
Key Insights
- Ethereum price held key support as derivatives demand turned positive.
- ETF inflows returned, signaling renewed U.S. investor interest.
- On-chain supply tightened as exchange reserves hit multi-year lows.
Ethereum price stabilized near $2,150 this week as derivatives demand recovered and ETF inflows turned positive. CryptoQuant and SoSoValue data showed rising buying pressure across futures and spot markets. The shift occurred as exchange reserves declined, pointing to tightening supply conditions.
 ETH Net taker volume. Source: CryptoQuant
CryptoQuant data showed that the Ethereum price entered a new phase, with net taker volume remaining positive since early March. The metric reached $140 million mid-month before stabilizing near $104 million, confirming aggressive buying activity. Analyst Darkfost said this marked the first sustained demand shift since the previous bear cycle.
That reaction mirrored renewed derivatives activity, which pushed open interest in futures toward cycle highs. The total number of outstanding contracts climbed to 6.4 million ETH, recovering steadily after dropping to 5 million ETH months earlier. Darkfost noted that derivatives markets remained active, indicating traders were positioning for directional movement.
Ethereum Price Gains Support From ETF Flow Reversal
SoSoValue data showed Ethereum price gained momentum after spot Ether exchange-traded funds recorded $120 million in daily net inflows. The move followed several sessions of outflows, signaling renewed interest from U.S. investors. This shift occurred as institutional demand returned to support spot market activity.
 Spot ETH ETF flows chart. Source: SoSoValue
BSCN reported that exchange reserves dropped by 77% from their 2021 peak, indicating reduced available supply on trading platforms. That decline coincided with rising futures volume, which reached $50 billion within a single day. The tightening liquidity environment suggested that any sustained demand could amplify price movements.
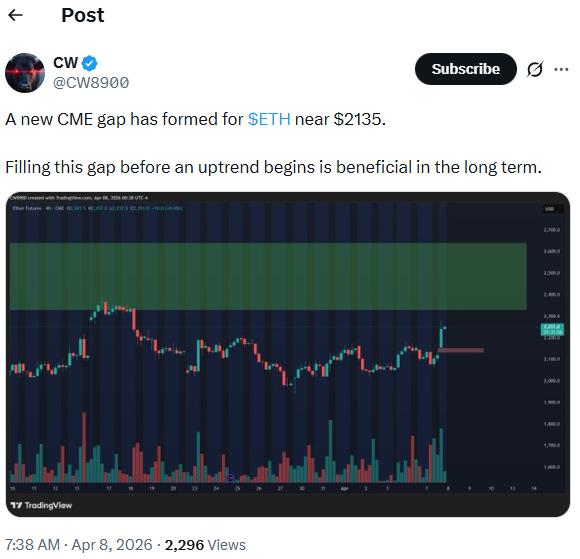 Source: X
CW noted that a Chicago Mercantile Exchange gap formed near $2,135, adding a short-term technical level to watch. Filling this gap could precede further upside if market conditions remained stable. Traders often monitor such gaps as part of short-term positioning strategies.
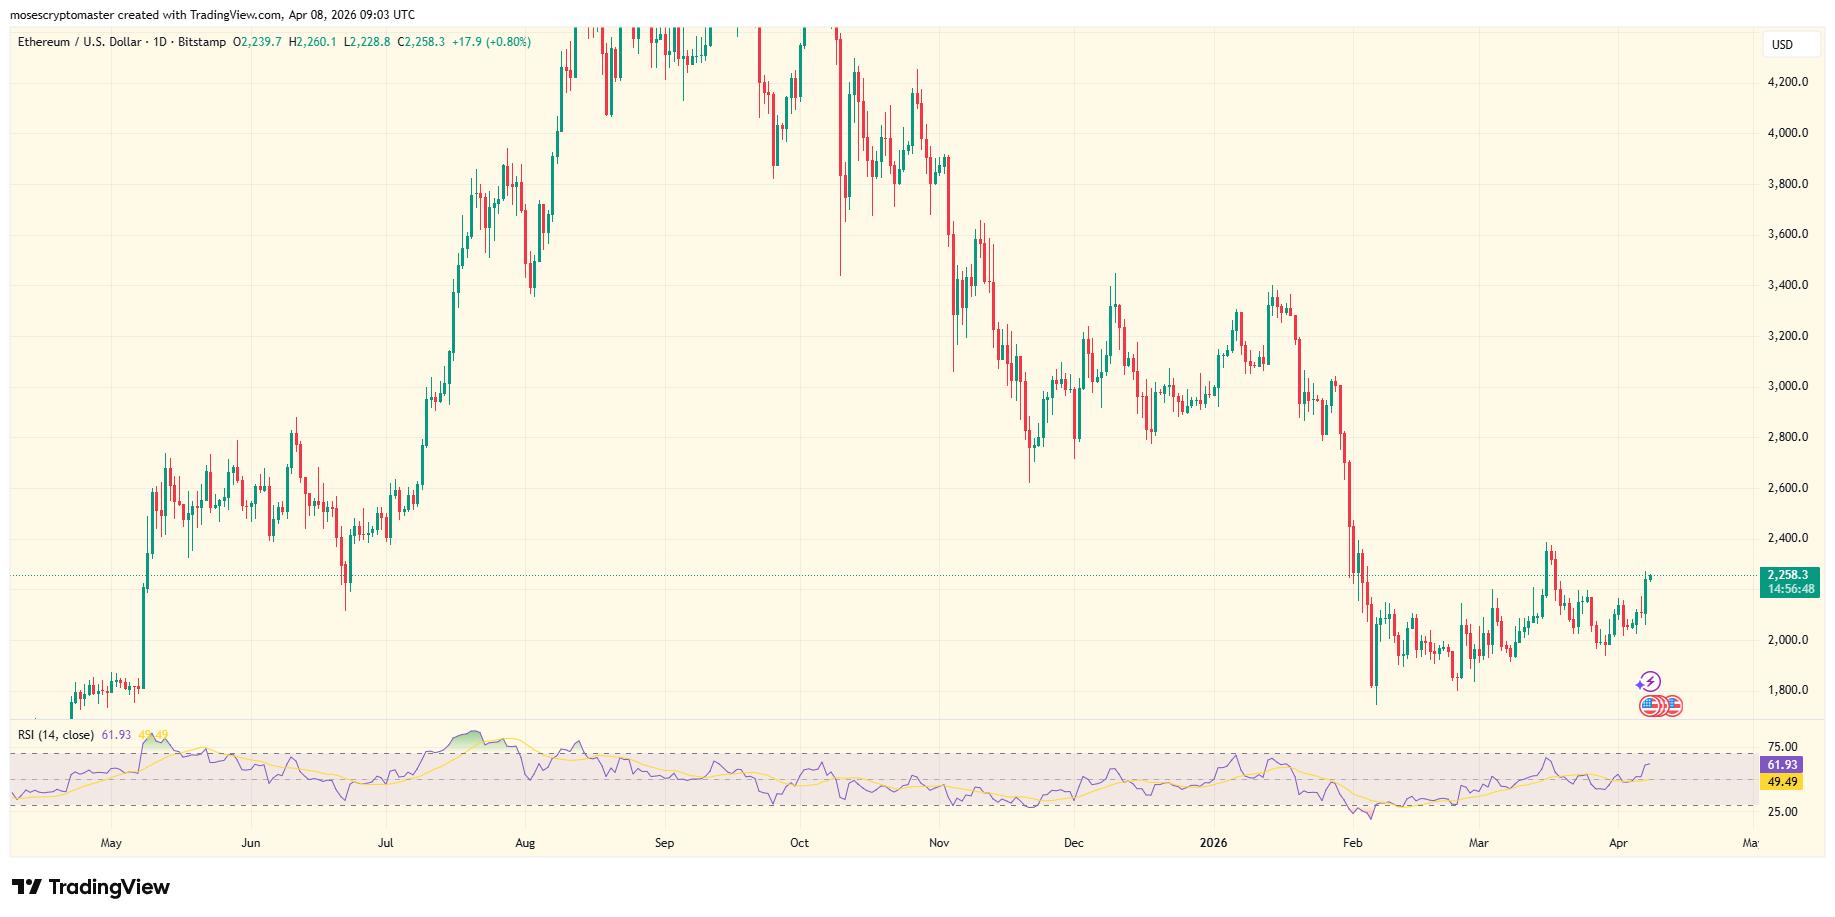
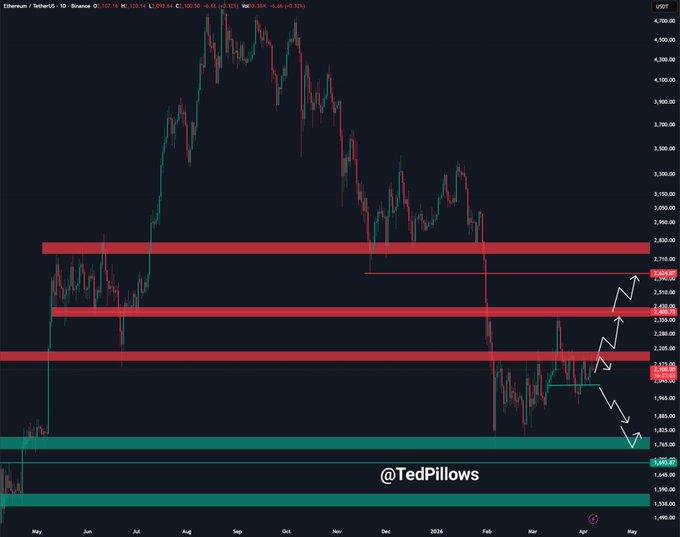
Ethereum Price Faces Critical Technical Structure Near Support
TradingView data showed Ethereum price held a key support zone defined by converging indicators and historical accumulation levels. The 20-day exponential moving average aligned with the lower boundary of a symmetrical triangle pattern, forming a technical base.
 Source: X
Glassnode data revealed that over 3.5 million ETH were accumulated near this region, reinforcing it as a cost-basis cluster. Below that, another demand band emerged where 1.36 million ETH changed hands, providing a secondary support layer. These levels indicated where buyers previously entered the market.
 Source: X
Analyst Ted Pillows stated that maintaining this structure would allow Ethereum price to attempt a move toward higher resistance zones. He warned that losing this support could trigger further downside, as technical patterns would invalidate bullish setups.
Ethereum Price Outlook Hinges on Structural Support Hold
Ethereum price now faces a near-term test as market participants watch whether support levels continue to hold. Sustained ETF inflows and derivatives demand could drive continuation if buying pressure persists. A breakdown below key zones would shift focus toward lower targets, while holding structure keeps bullish momentum intact.
The post Ethereum Price Holds $2K as ETF Flows Signal Demand Shift appeared first on The Market Periodical.


You May Also Like

GOP in disarray as Senate seat pick-up slips away: 'It's a mess'

Treasury advances GENIUS Act, tightening illicit-finance oversight


