Momentum Ignites: Can MUBARAK Extend Its 11% Breakout Into a Stronger Bullish Phase?
- MUBARAK trades at $0.020 after an 11% jump.
- Its daily trading volume has reached $31M.
A 3.30% loss in the crypto market has turned the charts blood-red. With the Fear and Greed Index value settled at 12, the overall bias is extreme fear. The bears are in control, dictating the asset’s direction. Only a steady bullish push could prevent prices from falling further. Among the pack, MUBARAK has seen a jump of over 11.92% in the last 24 hours.
In the early hours, the token traded at its low range of $0.01711. With the eventual brief bullish wave, the MUBARAK price has tested key resistances between $0.01718 and $0.02099. Then it rose to a high of $0.02107. At the time of writing, MUBARAK traded around $0.02063, with its daily trading volume having dropped by 4%, reaching $31.58 million.
If MUBARAK’s bullish shift gained enough strength, the price could climb toward a resistance of $0.02076. Upon clearing this range, the bulls might trigger the golden cross to take place and send the price toward the $0.02090 level or even higher.
On the downside, assuming MUBARAK loses the momentum, the bears could pull the price back to its support at around $0.02050. An extended bearish correction might initiate the death cross to unfold, driving the price lower below the $0.02037 mark.
MUBARAK’s Momentum Is Balanced — What is Coming Next?
The Moving Average Convergence Divergence (MACD) line of MUBARAK is situated above the signal line, thus the momentum is positive. The bullish crossover is active, and as both lines are above the zero line, the broader trend remains bullish.
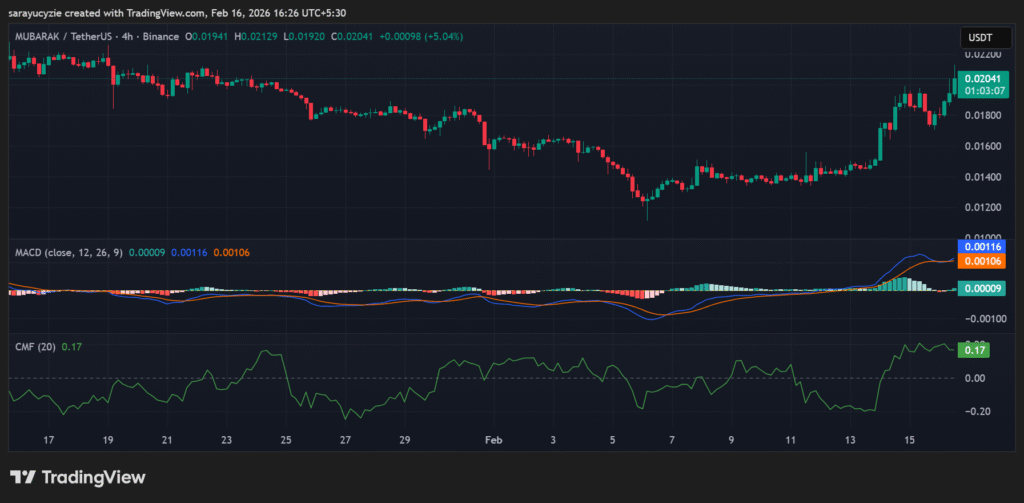 MUBARAK chart (Source: TradingView)
Moreover, the Chaikin Money Flow (CMF) indicator is positioned at 0.17 points toward a moderate buying pressure. Also, the money is flowing into the asset, which supports the bullish sentiment, and the strength is steady rather than aggressive.
MUBARAK’s Bull-Bear Power (BBP) reading of 0.00344 displays very slight bullish pressure. The buyers have a marginal edge, the momentum is weak, and the market may be near equilibrium. Furthermore, the daily Relative Strength Index of 71.72 implies strong bullish sentiment. The asset is in the overbought zone, and it may be nearing short-term exhaustion if RSI continues to rise.
Top Updated Crypto News
Early Signs of Weakness Emerge: Will Humanity Protocol Test the Bullish Structure?
You May Also Like

SEC Greenlights Generic Listing Standards, Paving Faster Path for Crypto ETPs

‘MAGA loudmouths’ make big admission about Trump endorsements: report