

Gold Price Plummets to Fresh Monthly Low as Fed Decision Looms
BitcoinWorld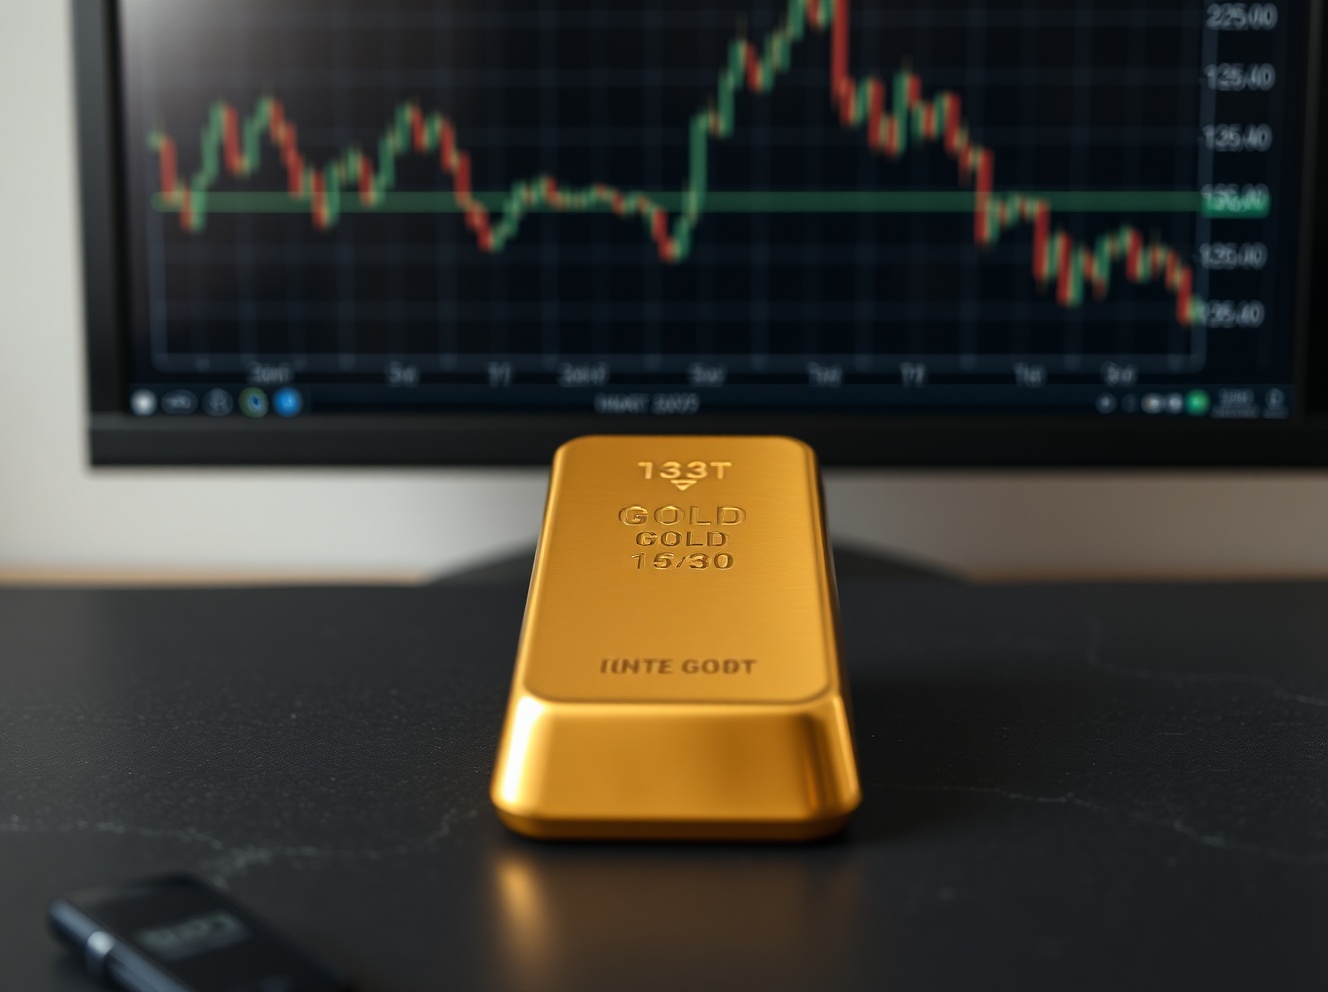
Gold Price Plummets to Fresh Monthly Low as Fed Decision Looms
Gold prices have plunged to a fresh monthly low in global markets, a significant move that underscores mounting investor anxiety ahead of a pivotal Federal Reserve policy announcement. This decline, captured starkly in recent trading charts, reflects a broader recalibration of expectations for interest rates and the U.S. dollar’s strength. Consequently, traders are rapidly adjusting their portfolios, shifting capital away from non-yielding assets like bullion. The precious metal’s traditional role as a safe haven is being tested by the powerful gravitational pull of central bank policy. Market analysts are now scrutinizing every data point for clues about the Fed’s next move.
Gold Price Charts Signal a Clear Downtrend
Technical analysis of recent gold price charts reveals a pronounced bearish pattern. The spot price for gold breached several key support levels this week, culminating in its lowest settlement in over four weeks. For instance, the $2,150 per ounce level, once considered a strong floor, gave way under sustained selling pressure. This breakdown is visually evident on daily and weekly charts, which show a series of lower highs and lower lows. Moreover, trading volume has increased during the sell-off, confirming the strength of the downward move. Market technicians point to the 50-day moving average crossing below the 100-day average as another negative signal.
Several chart-based indicators are flashing warning signs for gold bulls. The Relative Strength Index (RSI) has dipped into oversold territory, suggesting the sell-off may be excessive but also indicating strong downward momentum. Additionally, key momentum oscillators continue to trend lower, failing to show any meaningful divergence that would hint at an impending reversal. This technical deterioration aligns perfectly with the fundamental headwinds building against the precious metal. The chart narrative is unambiguous: sellers are currently in firm control of the gold market.
Expert Analysis of the Chart Breakdown
“The chart structure for gold has weakened considerably,” notes senior market strategist, Dr. Anya Sharma of Global Macro Insights. “The break below the late-February consolidation zone was a critical technical event. Historically, such breaks have led to follow-through selling, especially when driven by macro fundamentals like shifting rate expectations. We are now watching the next major support zone around $2,080.” This expert perspective highlights how chart analysis and fundamental drivers are converging. Sharma’s firm tracks correlations between Treasury yields and gold, which have recently strengthened to their most negative level this year.
The Federal Reserve Decision: The Primary Catalyst
The dominant force behind gold’s slide is the imminent Federal Open Market Committee (FOMC) decision. Markets are overwhelmingly focused on the central bank’s updated “dot plot” of interest rate projections and Chair Jerome Powell’s subsequent press conference. Strong recent inflation and employment data have forced investors to dramatically scale back expectations for near-term interest rate cuts. Higher-for-longer interest rates directly increase the opportunity cost of holding gold, which offers no yield. Simultaneously, they typically bolster the U.S. dollar, making dollar-priced gold more expensive for foreign buyers.
The market’s shifting expectations are quantifiable. According to CME Group’s FedWatch Tool, the probability of a June rate cut has fallen below 50%, a stark reversal from just a month ago. This repricing has triggered a sustained rally in U.S. Treasury yields, particularly on the short end of the curve. The table below illustrates the sharp move in key benchmarks over the past month:
| Financial Instrument | Price/Yield (One Month Ago) | Current Price/Yield | Change |
|---|---|---|---|
| Gold (Spot, per oz) | $2,185 | $2,125 | -2.7% |
| U.S. 2-Year Treasury Yield | 4.35% | 4.65% | +0.30% |
| U.S. Dollar Index (DXY) | 103.5 | 104.8 | +1.3% |
This synchronized move—higher yields, a stronger dollar, and weaker gold—is a classic market reaction to hawkish central bank expectations. The Fed’s communication will determine if this trend accelerates or pauses.
Broader Market Impacts and Real-World Context
The decline in the gold price reverberates across multiple financial sectors and has tangible real-world effects. Firstly, mining stocks and ETFs tied to the gold sector are underperforming the broader equity market. Secondly, central banks, which have been consistent net buyers of gold in recent years, may see the value of their reserves dip temporarily. For consumers, a lower gold price could translate to slightly cheaper jewelry, though retailer margins often dampen this immediate pass-through. However, industrial users in electronics and dentistry benefit from lower raw material costs.
Geopolitical tensions, which often support gold, have taken a backseat to monetary policy for now. This illustrates a key dynamic: while gold is a perennial safe-haven asset, its price in the short to medium term is frequently dictated by real interest rates and currency movements. The current environment shows that even amid global uncertainty, the mathematical certainty of rising bond yields can overpower避险情绪 (risk-off sentiment). Other precious metals like silver and platinum are also feeling pressure, though their higher industrial component creates a slightly different demand profile.
The Historical Relationship Between Rates and Gold
Historical data provides crucial context for the current move. Analysis from the World Gold Council shows that in cycles where the Fed has embarked on a hiking pause or a “higher-for-longer” regime, gold has typically faced initial headwinds. However, performance in the 12 months following the *last* rate hike of a cycle has often been positive. This pattern suggests that while the immediate reaction is negative, the peak in rates could eventually set a floor for gold. Investors are thus caught between short-term technical selling and longer-term strategic positioning for a eventual policy pivot.
What Traders and Analysts Are Watching Next
Market participants have identified several key levels and signals to monitor following the Fed’s announcement. On the charts, the aforementioned $2,080 level is critical; a sustained break below could open the path toward $2,000. Conversely, a recovery above $2,150 could signal that the sell-off was overdone. Fundamentally, every word from Chair Powell will be parsed for hints about the balance between fighting inflation and preserving economic growth. Specifically, analysts will listen for:
- Changes in inflation language: Any acknowledgment of stalled progress or need for prolonged vigilance.
- Labor market assessment: Signs of concern about weakening would be gold-positive.
- Balance sheet runoff (QT): Discussions about slowing or tapering quantitative tightening.
Furthermore, upcoming economic data releases, particularly the Personal Consumption Expenditures (PCE) price index, will immediately test the Fed’s new messaging. The market’s reaction in U.S. Treasury yields and the DXY dollar index will provide the next direct cue for gold’s direction. A sharp further rise in yields would likely extend gold’s pain, while a “dovish” surprise from the Fed could trigger a swift short-covering rally.
Conclusion
The gold price decline to a fresh monthly low is a direct and logical consequence of shifting expectations for Federal Reserve policy. Charts clearly depict the breakdown, driven by the powerful fundamentals of rising real yields and a resilient U.S. dollar. While geopolitical risks remain, the immediate path for bullion is tied inextricably to central bank messaging and economic data. The upcoming Fed decision will therefore serve as a major catalyst, either confirming the current bearish trend or providing the impetus for a stabilization. Investors should prepare for continued volatility as the market digests the Fed’s latest guidance on the fight against inflation.
FAQs
Q1: Why does the Federal Reserve decision impact the gold price?
The Fed sets U.S. interest rates. Higher rates increase the opportunity cost of holding non-yielding gold and often strengthen the U.S. dollar, making gold more expensive in other currencies. Markets are selling gold in anticipation of a more hawkish (rate-hike favoring) Fed stance.
Q2: What key chart level are traders watching for gold now?
Technical analysts are closely monitoring the $2,080 per ounce support level. A decisive break below this area could signal further downside, while holding above it might suggest the current sell-off is finding a floor.
Q3: Could geopolitical risk cause gold to rebound despite the Fed?
Yes, historically, major geopolitical escalations can trigger swift safe-haven flows into gold, temporarily overriding interest rate concerns. However, in the current cycle, monetary policy has been the dominant driver.
Q4: How are other precious metals like silver performing?
Silver is also under pressure, often exhibiting higher volatility than gold. Its larger industrial demand component can sometimes provide relative support, but it generally correlates with gold in broad risk-off or dollar-strength environments.
Q5: What would cause the gold price to reverse and start rising again?
A clear signal from the Fed that rate cuts are imminent, a sharp drop in U.S. Treasury yields, a significant weakening of the U.S. dollar, or a major escalation in geopolitical risk could all catalyze a sustained rebound in the gold price.
This post Gold Price Plummets to Fresh Monthly Low as Fed Decision Looms first appeared on BitcoinWorld.
You May Also Like

Bitcoin ETFs Surge with 20,685 BTC Inflows, Marking Strongest Week

ZEC Rally and G Coin — Two Altcoin Setups Worth Watching

