

Crypto Price Prediction for Today, April 22: SUI, Chainlink (LINK), XRP

This crypto price prediction for today, April 22, 2026, examines the price structures of Sui, Chainlink, and XRP and what current data suggests about the next move.
Price behavior across these assets shows a mix of consolidation and gradual recovery. That combination often leads to decisive moves once key levels break. The next few hours could determine whether buyers are ready to take control or if resistance continues to slow momentum.
SUI Price Structure Shows Tight Range With Bullish Indicator Support
SUI continues to trade inside a narrow consolidation that started earlier this year. A closer look at the recent chart shows that price moved above the $0.96 resistance yesterday. That move pushed price quickly toward $0.9748 where another resistance level slowed the advance.
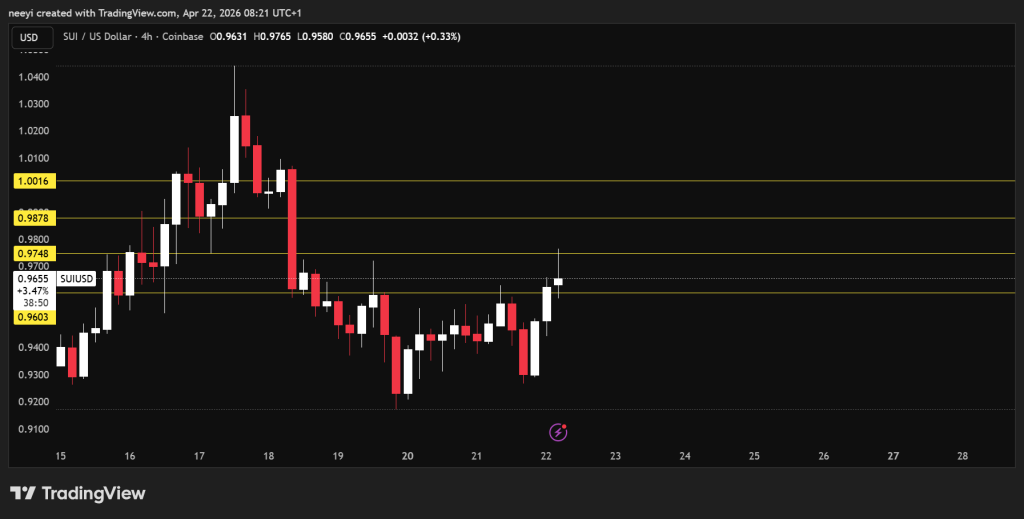 SUI Price Chart Showing Key Levels / Source: TradingView.com
Price has since pulled back slightly and now sits around $0.968. The current trading range remains between $0.960 and $0.974, which shows that the market is compressing ahead of a possible breakout.
A look at indicator readings from investing.com on the 5-hour chart gives more insight into the current bias:
The readings above show a consistent buy signal across all major indicators. RSI remains above neutral levels, which points to steady demand. MACD shows early bullish alignment, which often appears before stronger moves. ADX strength above 25 suggests that the trend has some structure behind it.
| Name | Value | Action |
|---|---|---|
| RSI(14) | 55.387 | Buy |
| STOCH(9,6) | 59.005 | Buy |
| MACD(12,26) | 0.001 | Buy |
| ADX(14) | 27.712 | Buy |
| Ultimate Oscillator | 55.389 | Buy |
| Bull/Bear Power(13) | 0.0276 | Buy |
Price action also aligns with this outlook. Buyers continue to defend the lower range while pushing gradually toward resistance.
SUI Price Prediction For Today
- The bullish bias means a break above the $0.974 resistance is possible today. A successful move above that level could open the path toward the next resistance around $0.798.
Momentum will play a key role here. Continued strength without negative news could support a move higher. A breakdown below $0.957 looks unlikely based on current structure.
- The worst-case scenario would see price remain trapped between $0.95 and $0.974 as the market waits for a clearer direction.
Chainlink Price Structure Shows Gradual Uptrend From Strong Support Base
Chainlink price has maintained a structured pattern since February. Consolidation has dominated the broader trend, although price continues to form higher highs and higher lows within that structure.
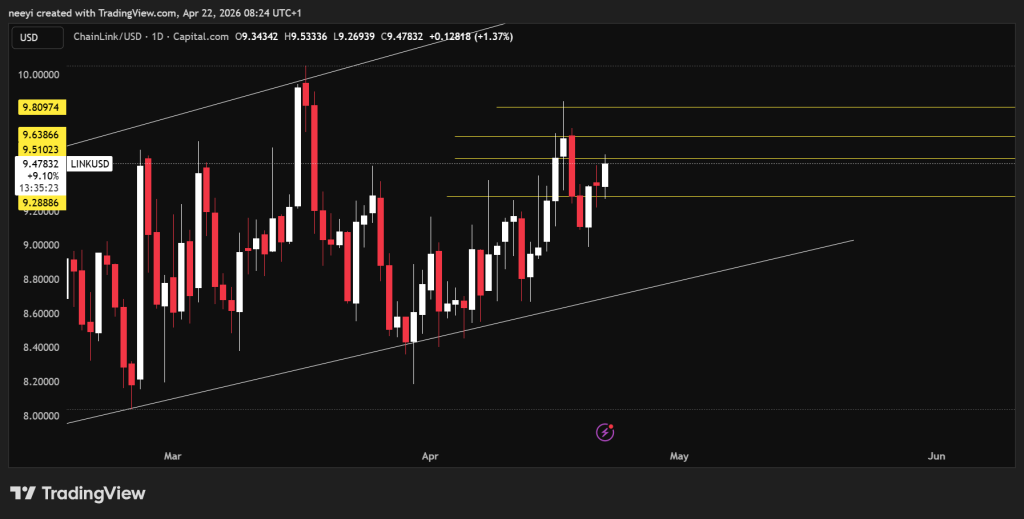 LINK Price Chart Showing Key Levels / Source: TradingView.com
The base of this pattern has acted as strong support for months. The upper boundary continues to act as resistance, which creates a controlled trading environment.
The last bounce from the base occurred in mid-April. Since then, price has moved upward steadily with only minor pullbacks. Today’s session shows continued strength after price rebounded from support near $9.29.
The next key resistance sits around $9.63. That level previously rejected price twice on April 17 and April 18. A decline of more than 6% followed those rejections, which makes this level important again.
Indicator readings from investing.com on the 5 hour chart provide further clarity:
| Name | Value | Action |
|---|---|---|
| RSI(14) | 61.479 | Buy |
| STOCH(9,6) | 72.477 | Buy |
| MACD(12,26) | 0.07 | Buy |
| ADX(14) | 21.366 | Buy |
| Ultimate Oscillator | 55.618 | Buy |
| Bull/Bear Power(13) | 0.26 | Buy |
The readings confirm a bullish bias. RSI shows strong momentum above 60. Stochastic remains elevated, which signals continued buying pressure. MACD supports the trend with positive values.
This alignment between indicators and price structure supports the idea that buyers still control the trend.
LINK Price Prediction For Today
- The most likely scenario for today remains bullish. Price could break above the immediate resistance near $9.51 and then move toward the $9.63 level, which has acted as a rejection zone before.
A clean break above $9.63 could open the door for further upside in the near term.
- A weaker scenario would keep price within a range between $9.27 and $9.51. That outcome would signal temporary hesitation without changing the broader structure.
XRP Price Movement Retests Key Resistance After Recent Bounce
XRP price continues to follow a similar structure seen in the previous session. Yesterday, we predicted a possible decline toward $1.39, with further downside toward $1.35 if weakness increased.
Price did decline to $1.39 before buyers stepped in and pushed it higher again. That reaction confirms that buyers remain active near lower levels.
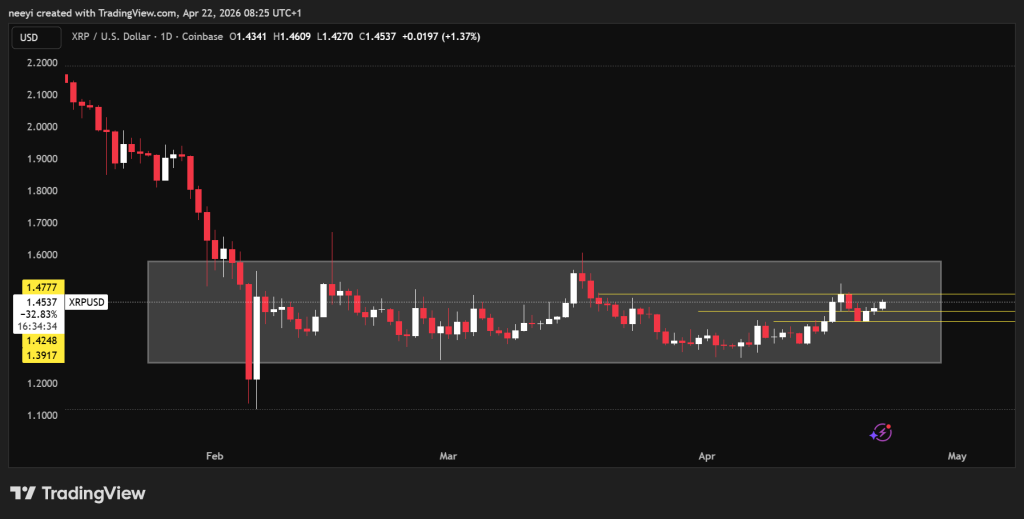 XRP Price Chart Showing Key Levels / Source: TradingView.com
Current price action shows XRP trading around $1.457 and moving toward resistance near $1.477. That level is important because it previously triggered a 6% decline over the weekend.
The possibility of another rejection remains, especially since sellers may still target that zone.
Indicator readings from investing.com on the 5 hour chart provide additional context:
| Name | Value | Action |
|---|---|---|
| RSI(14) | 62.258 | Buy |
| STOCH(9,6) | 66.858 | Buy |
| MACD(12,26) | 0.012 | Buy |
| ADX(14) | 21.361 | Buy |
| Ultimate Oscillator | 58.729 | Buy |
| Bull/Bear Power(13) | 0.0296 | Buy |
The data shows a clear bullish bias. RSI above 60 indicates strong demand. MACD remains positive, which supports upward movement. ADX suggests a developing trend rather than a weak market.
XRP Price Prediction For Today
- The bullish setup supports a move toward the $1.477 resistance. Price could reach that level and then trade within a range as sellers attempt to defend it.
A strong break above $1.477 could lead to new levels near $1.5 in the coming days. That outcome depends on sustained buying pressure.
- A weaker scenario would see another rejection at $1.47. That could push price back toward the lower $1.4 region again.
FAQs
Subscribe to our YouTube channel for daily crypto updates, market insights, and expert analysis.
The post Crypto Price Prediction for Today, April 22: SUI, Chainlink (LINK), XRP appeared first on CaptainAltcoin.


You May Also Like

Gold Spot Volume on Binance Surges to $80M as Demand Extends Beyond Futures

WTI Oil eases to $87.50 amid a fragile US-Iran ceasefire


