

The NFT Market Has Been Struggling Lately, Amid 50% Tank In A Month
The NFT market value has plunged 46% in 30 days, after dropping from $6.6B to $3.5B. Here are the details of what happened.
The global NFT market value has fallen, even as trading activity picked up.
According to CoinGecko, total market cap dropped 46% in the last 30 days after slipping from around $6.6 billion on October 5 to $3.5 billion by early November.
The weight of this decline thus shows how fragile investor confidence can be, despite more users engaging in NFT trades.
A Closer Look at the NFT Market
CryptoSlam reported that NFT sales reached about $631 million in October. This stood as a 13% increase from September’s $556 million. Despite the uptick, most major networks suffered declines in value.
Ethereum, the largest blockchain for NFTs, saw a 25.5% drop, while Solana, Immutable, and Avalanche recorded losses between 31% and 35%.
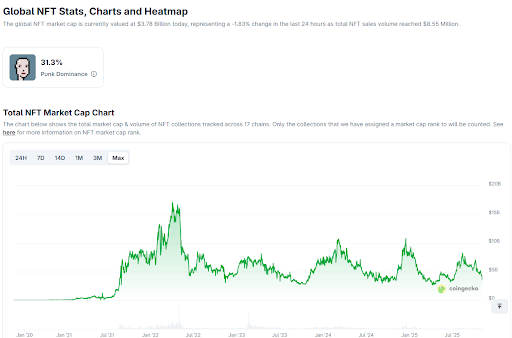 The global NFT stats appear to have tanked | source- CoinGecko
BNB Chain and Polygon were hit hardest and posted declines of 82% and 86%. Only Bitcoin and Base NFTs managed to grow, rising 9% and 24% respectively.
These numbers show how uneven the market has become, with certain segments showing strength while most others struggle.
Blue-Chip NFTs Take a Major Hit
Even top-tier NFT collections which are often seen as safer bets couldn’t avoid the downturn. Data from NFT Price Floor showed CryptoPunks’ floor price dropped from around $214,000 in early October to $117,000 by November 5.
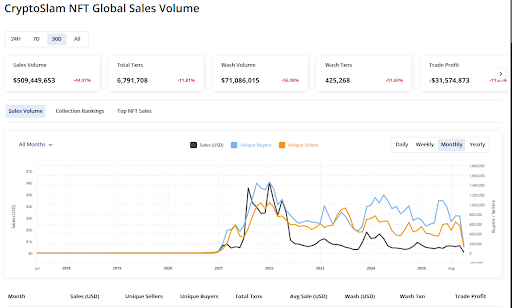 The blue-chip NFTs appear to have taken the worst hits | source- CryptoSlam
This stood as a 40% decrease and Moonbirds fared even worse with a 63% drop in volume and a floor price plunge from $14,700 to $6,500. The trend extended to other well-known projects.
Bored Ape Yacht Club (BAYC) saw a 30% increase in trading volume but lost nearly half of its floor value after falling from $36,700 to $19,500.
Pudgy Penguins followed a similar path with an 83% increase in activity but a floor price slide from $43,000 to $18,340.
The Disconnect Between Activity and Value
The NFT market is showing a strange split. More trades are happening, yet asset values keep dropping. This gap indicates that current market activity is driven more by speculation than by genuine investor conviction.
Analysts say that short-term traders are cycling through assets faster and are creating artificial volume without supporting higher prices.
That kind of behaviour keeps the market volatile and unpredictable. It also shows how dependent NFTs still are on the performance of the crypto market.
Major Players Change Strategy
As valuations shrink, some big players in the NFT space are making changes.
OpenSea, the largest NFT marketplace with over 522,000 active traders in the past month announced plans to transform into a universal on-chain trading hub.
The company said it is increasing its focus beyond digital art and collectables to include all types of on-chain assets. While OpenSea denied that it’s abandoning NFTs, the trend shows a move toward more diversified revenue sources.
On the other hand, well-known web3/metaverse investor Animoca Brands is also adapting. The company recently confirmed plans to list on the Nasdaq, in a show of traditional market interest.
This move comes just as secondary NFT markets cool and is indicating that the future of NFTs may depend on their integration into gaming other systems, rather than pure art speculation.
The post The NFT Market Has Been Struggling Lately, Amid 50% Tank In A Month appeared first on Live Bitcoin News.
You May Also Like

Developers of Altcoin Traded on Binance Reveal Reason for Major Price Drop – “Legal Process Has Begun”

Gate Alpha is launching its 113th round of points airdrops. Holders of the corresponding points can be among the first to receive 0.9 or 4.5 TRUMP.
