NKN Price Prediction 2025-2031: Will NKN Price Record New Gains?
Key Takeaways
- NKN price prediction suggests a bullish trend, with NKN anticipated to reach $0.0315 by the end of 2025.
- NKN could reach a maximum price of $0.1090 by the end of 2028.
- By 2031, NKN’s price may surge to $0.3261.
NKN (New Kind of Network) is a startup that Yanbo Li, Bruce Li, and Yilun Zhang founded. NKN is a new type of project, an acronym of New Kind of Network, and can be placed alongside previous decentralized internet initiatives, such as Substratum and Ontology, but falls into a contemporary Web3 triumvirate:
NKN offers decentralized networking, Ethereum offers decentralized computing, and Filecoin/IPFS offers decentralized storage. Among the first demonstrations of NKN was its Smart Home IoT Proof-of-Concept, which it described as the “Airbnb of the Future” and showed a decentralized sharing economy based solely on peer-to-peer connectivity, indicating its potential for future growth.
NKN network is still deploying upgrades and growing real-world applications despite the market being suspicious, liquidity issues, and further volatility following the Binance delisting of the NKN/BTC pair on August 6, 2025. Recent activities and projects have been the Streamer Incentives Program (200,000 NKN rewards), the redesigned nMobile decentralized messaging application, and continuous utility integrations, including iQIYI content delivery, China Mobile edge computing, D-Chat, and nShell.
In this NKN price prediction and NKN forecast article, we assess the price history, market sentiment, support levels and resistance levels, and other major technical indicators to understand whether the future of NKN is a stabilization or a further decline within 2025 to 2031.
Overview
| Cryptocurrency | New Kind of Network |
| Token | NKN |
| Current NKN Price | $0.01476 |
| Market Cap | $11.73M |
| Trading Volume 24-h | $1M |
| Circulating Supply | 794,511,344.81 NKN |
| All-time High | $1.48 Apr 09, 2021 |
| All-time Low | $0.006411, Mar 13, 2020 |
| 24-h High | $0.01547 |
| 24-h Low | $0.01452 |
NKN price prediction: Technical analysis
| Sentiment | Bearish |
| 50-Day SMA | $0.02029 |
| 200-Day SMA | $0.03120 |
| Price Prediction | $ 0.01717 (13.73%) |
| Fear & Greed Index | 11 (Extreme Fear) |
| Green Days | 13/30 (43%) |
| 14-Day RSI | 33.72 (Neutral) |
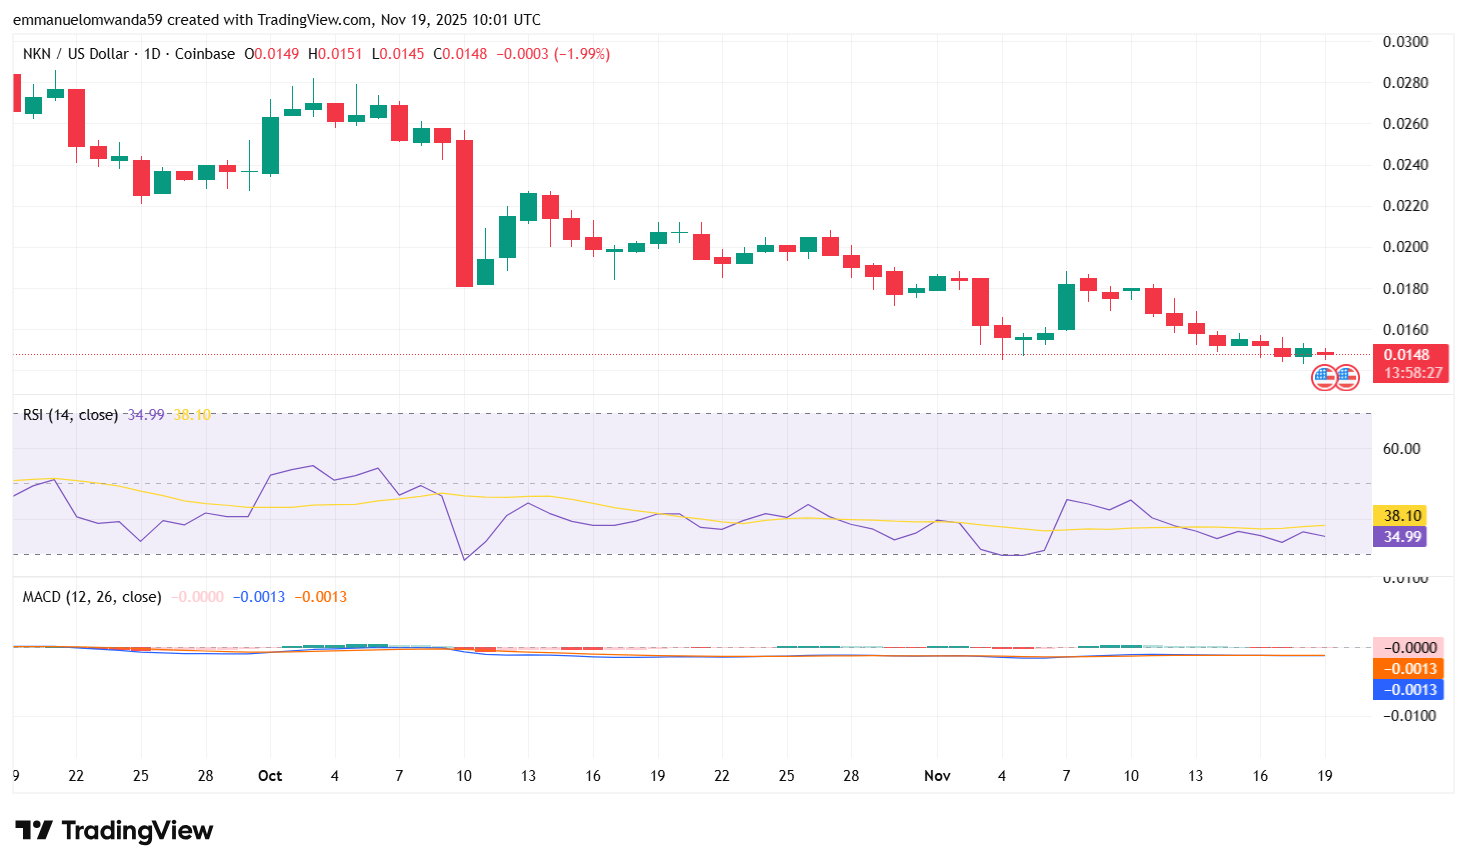
NKN price analysis 1-day chart
TL;DR Breakdown:
- NKN trades at $0.0148, down by 1.99% in the last 24 hours after touching a low of $0.0145 earlier today.
- Price action for NKN is still weak as bears dominate, with no strong bullish reaction on the chart.
- NKN trades below its 50-day and 100-day Moving Averages, confirming a bearish trend.
As of November 19, 2025, NKN is trading around $0.0148, struggling to rebound after declining throughout the week. NKN briefly dipped to $0.0145, its lowest point of the month, before a small corrective bounce. The price is trading below both the 50-day and 100-day Moving Averages, indicating a bears are firmly in control, although selling momentum has slowed, buyers have yet to show meaningful commitment at the current market structure. The narrow sideways movement near the lows reflects indecision but does not show a shift in sentiment toward accumulation. Immediate resistance lies at $0.0155 and $0.0160, while support holds at $0.0145, the key level to avoid a deeper breakdown.
NKN price analysis 1-day Chart
The 1-day chart shows a clear downtrend with a series of lower highs and lower lows. NKN has been trending downward since early October, sliding from the $0.018 and $0.020 region down to the current $0.0148 zone. The candles continue to print red more frequently than green, signaling persistent bearish strength and highlighting potential oversold conditions.
 NKNUSDT Chart: TradingView
RSI sits at 34.99, which reflects weakening momentum near the oversold zone. There is no bullish divergence visible on the chart. A move back above 40–45 RSI would be the first early sign of recovery, but it hasn’t happened yet.
The MACD line and signal line are both at –0.0013, almost perfectly flat. The histogram is very small, showing weak, fading momentum. Bearish sentiment remains dominant no bullish crossover is forming. The chart shows smaller candle bodies recently, indicating reduced volatility
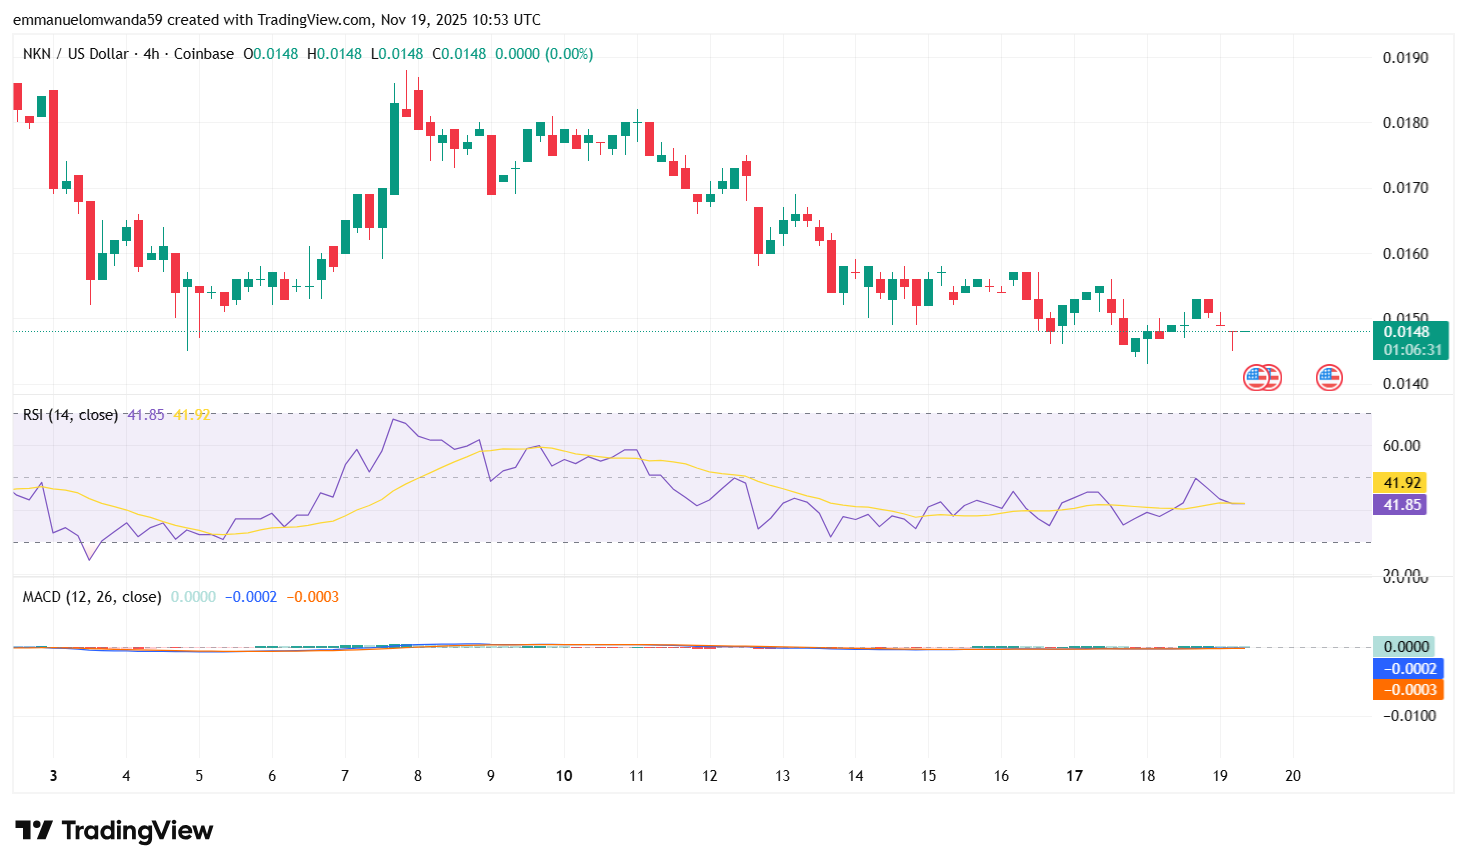
New Kind of Network Coin price analysis 4-hour chart
On the 4-hour chart, NKN trades around $0.0148, showing a flat intraday movement after recent weakness pushed the price toward the $0.0146 and $0.0147 zone. The chart reveals a gradual downtrend extending through mid-November, with the latest candles forming a tight consolidation pattern. This reflects a market in hesitation, with neither bulls nor bears demonstrating decisive control in the short term.
 NKNUSDT Chart: TradingView
RSI sits at 41.85, slightly below its signal line of 41.92. This indicates weak momentum with a slight bearish tilt. The RSI has been unable to push above the neutral 50 level, showing buyers are still cautious.
The MACD on the 4-hour chart remains flat and weak, with the MACD line at -0.0002, the signal line at -0.0003, and the histogram sitting at 0.0000. This extremely flat structure shows that momentum is almost nonexistent, offering no confirmation of a bullish reversal while still leaning slightly bearish due to the broader market trend.
Short-term levels remain well-defined, with resistance at $0.0151 to $0.0153, and support at $0.0146 to $0.0144. A breakout above $0.0151 could open the path toward $0.0153 to $0.0155, whereas a drop below $0.0146 may trigger a move down to $0.0144.
NKN technical indicators: Levels and action
Daily simple moving average (SMA)
| Period | Value | Action |
|---|---|---|
| SMA 3 | $0.01962 | SELL |
| SMA 5 | $0.01814 | SELL |
| SMA 10 | $0.01800 | SELL |
| SMA 21 | $0.01762 | SELL |
| SMA 50 | $0.02029 | SELL |
| SMA 100 | $0.02379 | SELL |
| SMA 200 | $0.03120 | SELL |
Daily exponential moving average (EMA)
| Period | Value | Action |
|---|---|---|
| EMA 3 | $0.01795 | SELL |
| EMA 5 | $0.01953 | SELL |
| EMA 10 | $0.02206 | SELL |
| EMA 21 | $0.02451 | SELL |
| EMA 50 | $0.02646 | SELL |
| EMA 100 | $0.02894 | SELL |
| EMA 200 | $ 0.03738 | SELL |
What to expect from the NKN price analysis?
NKN is currently showing a weak and consolidating trend, with indicators suggesting low momentum and a slight bearish bias as it trades just above its key support at $0.0146 and $0.0145. If this level holds, a small rebound toward $0.0151 to $0.0153 is possible, but losing it could trigger a deeper decline toward $0.0144.
Recent News/Opinion on NKN
NKN has launched a new incentive campaign to invite the streamers to test the novon.tv v0.4.0 live-streaming platform, where censorship-free transmission is valid and there are no intermediaries. The network has also granted a special reward pool of 200,000 NKN tokens to those creators who participate in the network, as it tries to grow its decentralized content delivery. NKN also released a detailed FAQ to guide streamers through setup, features, and reward distribution as adoption efforts intensify.
Is NKN a good investment?
NKN distinguishes itself in the cryptocurrency markets by focusing on decentralized networking and communication infrastructure. It aims to revolutionize how data is transmitted over the internet by creating a more secure, efficient, and open network powered by blockchain technology. With its innovative approach to peer-to-peer networking and growing demand for decentralized services, NKN has strong potential for long-term growth, which is reflected in various long-term forecasts. Its real-world applications in IoT, edge computing, and decentralized web services make it an attractive option for investors looking to diversify into promising blockchain projects.
Why is NKN down?
NKN is down mainly due to persistent bearish technicals, with the price trading below key moving averages and showing weak momentum. A broader altcoin liquidity crunch, driven by extreme fear in the market and rising Bitcoin dominance, is limiting buying interest. Additionally, lingering negative sentiment from Binance’s past delisting continues to weigh on trader confidence and overall liquidity.
Will NKN recover?
The recovery of NKN will be heavily dependent on its ability to recover momentum beyond major resistance points and gain more robust liquidity following its recent drop. The project is actively developing, and one of the ways includes novon.tv and nMobile that may enable a long-term recovery in case users become more active. Nevertheless, bearish technical signs and a low trading volume mean that recovery is likely to be gradual rather than immediate..
Will NKN reach $0.10?
Yes, analysts discuss the NKN prediction, projecting that NKN could reach the $0.10 price target as early as 2028, assuming consistent development progress, increased adoption of its decentralized networking solutions, and favorable future results.
Will NKN reach $0.20?
Many long-term projections indicate that NKN could surpass the $0.20 mark by the end of 2030, especially if global demand for decentralized networks continues to grow and the project maintains its current development trajectory.
Does NKN have a good long-term future?
NKN has a promising long-term outlook, presenting a bullish scenario due to its unique use cases in decentralized networking, strong developer community, and increasing relevance in a world moving toward decentralized infrastructure. As concerns around data privacy and centralized control of the internet rise, NKN’s vision of a democratized network becomes even more relevant—making it a compelling candidate for long-term investment, though it’s advisable to seek independent professional consultation.
NKN Price Prediction November 2025
For November 2025, the price of NKN is predicted to reach an average price of $0.02245, while the coin could trade between a maximum of $0.0304 and a minimum of $0.014.
| Month | Minimum Price ($) | Average Price ($) | Maximum Price ($) |
| November | $0.014 | $0.02245 | $0.0304 |
NKN Price Prediction 2025
The price of NKN is predicted to reach a minimum value of $0.014 in 2025. The NKN price could reach a maximum value of $0.0315 with the average trading price of $0.0230 throughout 2025.
| Year | Minimum Price ($) | Average Price ($) | Maximum Price ($) |
| 2025 | $0.014 | $0.0230 | $0.0315 |
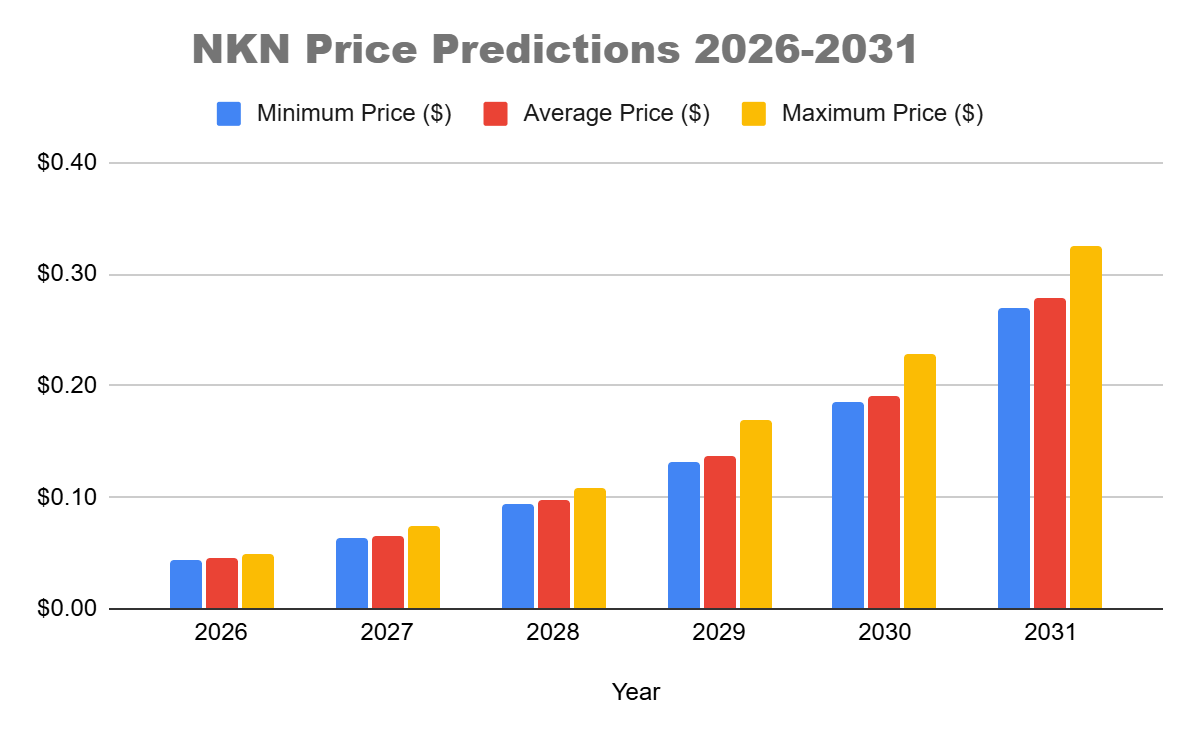
NKN Price Predictions 2026-2031
| Year | Minimum Price ($) | Average Price ($) | Maximum Price ($) |
| 2026 | $0.0440 | $0.0451 | $0.0497 |
| 2027 | $0.0632 | $0.0650 | $0.0745 |
| 2028 | $0.0946 | $0.0972 | $0.1090 |
| 2029 | $0.1323 | $0.1371 | $0.1695 |
| 2030 | $0.1862 | $0.1916 | $0.2285 |
| 2031 | $0.2689 | $0.2784 | $0.3261 |
NKN Price Prediction 2026
In 2026, the price of NKN is predicted to reach a minimum level of $0.0440. The NKN price can reach a maximum level of $0.0497, with the average trading price of $0.0451.
NKN Price Prediction 2027
Our NKN token forecast for 2027 is expected to reach a minimum price value of $0.0632. The NKN price can reach a maximum price value of $0.0745, with the average value of $0.0650.
NKN Price Prediction 2028
Our NKN forecast price of 1 NKN is expected to reach a minimum level of $0.0946 in 2028. The NKN price can reach a maximum level of $0.1090 with the average price of $0.0972 throughout 2028.
NKN Price Prediction 2029
Our NKN price prediction for 2029 is that NKN is predicted to reach a minimum level of $0.1323. The NKN price can reach a maximum level of $0.1695 with the average trading price of $0.1371..
NKN Price Prediction 2030
Our NKN cryptocurrency prediction for the 2030 price of NKN is forecasted to be at around a minimum value of $0.1862. The NKN price value can reach a maximum of $0.2285, with the average trading value of $0.1916 in USD.
NKN Price Prediction 2031
NKN price is forecast to reach $0.2689 in 2031. As per our findings, considering the current sentiment the NKN price could reach a maximum possible level of $0.3261 with the average forecast price of $0.2784.
 NKN Price Prediction 2025-2031
NKN Price Prediction by Cryptopolitan
Cryptopolitan’s NKN price forecast suggests a bullish outlook for NKN’s future price should the market recover soon. According to our expert analysis on market capitalization, influenced by investor sentiment, NKN might record a maximum price of $0.0315, a minimum price of $0.014, and an average price of $0.0230 at the end of 2025.
NKN Price History
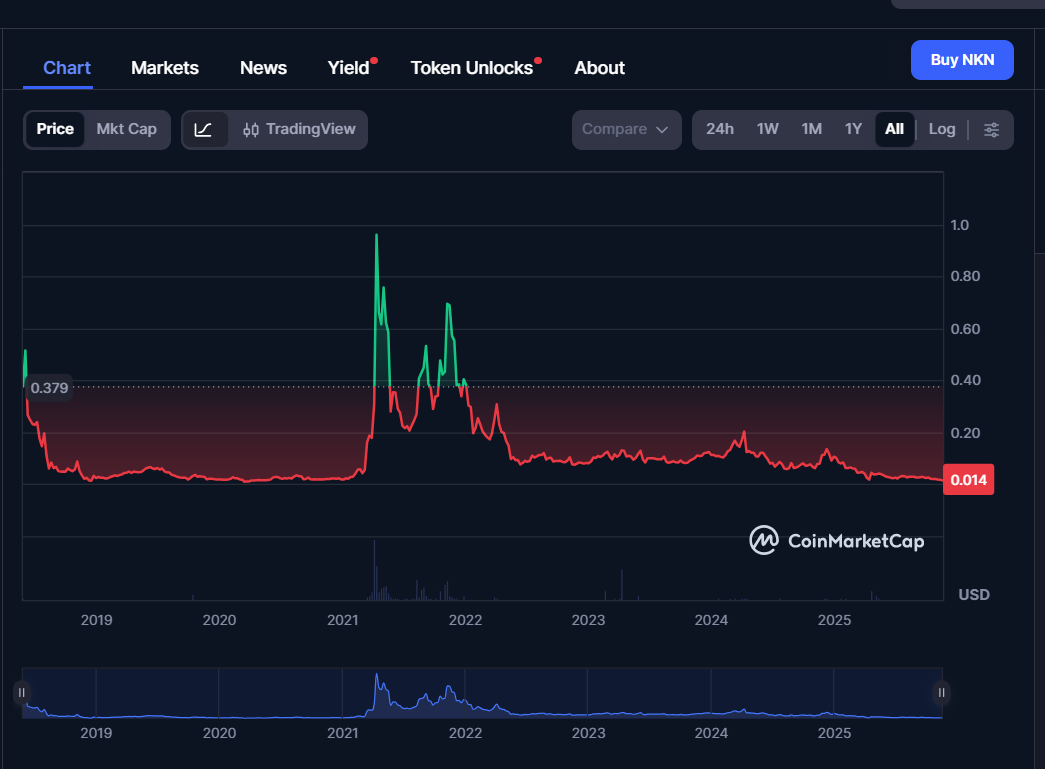 NKN Price History
- In early 2024, NKN traded steadily around the $0.11–$0.12 range. Through January and February, price movement was largely sideways, with NKN showing stability around $0.12. The market lacked strong momentum, and the asset remained range-bound throughout March as well.
- However, April 2024 marked the beginning of bearish pressure. NKN began declining from the $0.12 level, slipping below $0.10 by mid-April. This bearish trend deepened in May, with prices continuing their descent and briefly touching $0.09. The overall sentiment remained weak, and no major recovery was observed through the summer.
- By June and July 2024, NKN showed mild signs of recovery. The asset ranged between $0.07 and $0.08, but bulls failed to regain strong control. August brought further volatility, with the price swinging between $0.06 and $0.08 as speculative trading dominated the trend.
- September 2024 began on a slightly bullish note, but the rally quickly faded. By the end of the month, NKN had declined to nearly $0.068, erasing earlier gains. October and November were largely indecisive, with NKN trading in a tight channel between $0.06 and $0.07. The lack of volume and broader market consolidation contributed to this stagnation, making it challenging for investors to determine exit points.
- December 2024 sparked renewed optimism. A sudden surge pushed NKN to highs of $0.14 in early December. The price spiked briefly but failed to sustain above $0.13. A correction soon followed, and the asset closed the year around the $0.11 mark.
- January 2025 opened strong, with NKN hitting $0.10. The rally carried into February, peaking at $0.0823 early in the month. However, as in previous rallies, the momentum faded. March 2025 observed a gradual descent, with prices falling back to the $0.05 range by the end of the month.
- April 2025 was highly volatile. NKN initially dipped to as low as $0.0211 but then experienced a sharp recovery, closing the month near $0.0429. This recovery carried into May, although the price faced resistance around the $0.043 level. As of mid-May, NKN trades near $0.0397 — a slight dip from earlier in the month, as the asset continues to struggle with reclaiming bullish strength.
- May 2025 NKN recovery slowed, with NKN trading around $0.0397 as resistance near $0.043 capped upside attempts.
- June 2025: Bearish pressure reappeared, pushing NKN into the low-$0.03 range as liquidity weakened.
- July 2025, the NKN price downtrend continued, with the price slipping toward $0.025 amid persistent market selling.
- August 2025: Sentiment worsened after the NKN/BTC delisting, dragging the price into the $0.02 region and increasing volatility.
- September 2025: NKN hovered between $0.018 and $0.021 as buyers failed to generate a sustainable rebound.
- October 2025: NKN Price broke down further, touching a cycle low near $0.0145 as bearish momentum intensified.
- As of November 2025 19 2025, NKN trades around $0.0148, essentially flat but still holding near its yearly low as liquidity remains thin and market sentiment is cautious.
You May Also Like

Gold continues to hit new highs. How to invest in gold in the crypto market?

U.S. workers received 53.8% of GDP in the third quarter, the lowest share since records began in 1947