Key Takeaways Bitcoin’s (BTC) price rose 2.03% to $92,328 in 24 hours, while the overall crypto market fell 0.58% during the same time. This contrasts with its weekly and monthly declines, and coincided with the broader crypto market’s 1.37% gains, slightly outperforming the sector. The apex crypto’s mixed performance can be linked to a recent... The post Bitcoin Price Prediction Today (Nov 20): What’s Driving BTC Above $92K? appeared first on BiteMyCoin.Key Takeaways Bitcoin’s (BTC) price rose 2.03% to $92,328 in 24 hours, while the overall crypto market fell 0.58% during the same time. This contrasts with its weekly and monthly declines, and coincided with the broader crypto market’s 1.37% gains, slightly outperforming the sector. The apex crypto’s mixed performance can be linked to a recent... The post Bitcoin Price Prediction Today (Nov 20): What’s Driving BTC Above $92K? appeared first on BiteMyCoin.

Bitcoin Price Prediction Today (Nov 20): What’s Driving BTC Above $92K?

2025/11/20 16:37

Key Takeaways

  • Bitcoin (BTC) price surged 2.03% to $92,328 in 24 hours, outperforming the total crypto market’s gains. The apex crypto managed to reverse its weekly and monthly downtrend as ETF flows and whale accumulation returned.
  • Nvidia’s Q3 2025 revenue beat expectations to hit $57 billion, and boosted the stocks of Bitcoin mining firms, particularly IREN and Cipher, which have announced strategic AI partnerships with Google and Amazon.
  • BTC rebounded from its $88,570 support zone, while hitting “oversold” RSI levels. Historically, Bitcoin has reversed trends whenever RSI dipped below 30. The $88,500 – $90,000 demand zone also triggered algorithmic buying, pushing prices higher.

Bitcoin’s (BTC) price rose 2.03% to $92,328 in 24 hours, while the overall crypto market fell 0.58% during the same time. This contrasts with its weekly and monthly declines, and coincided with the broader crypto market’s 1.37% gains, slightly outperforming the sector.

The apex crypto’s mixed performance can be linked to a recent downtrend, with a surge in mining stocks, uncertainty surrounding record ETF outflows, and leverage unwinding driving the price.

Bitcoin (BTC) Price News

BTC price retested $89,000 after failing to reclaim $93,500 level. However, this triggered a $144 million liquidation event. Bitcoin derivatives remained relatively stable, with 30-day futures premiums holding at 4%, while funding rates mirrored two-week averages, and options skew showed no panic.

This also contrasts with $2.26 billion in spot Bitcoin ETF outflows over the last 5 days.

The market conditions project “neutral” as futures resilience suggests underlying confidence, but ETF outflows reveal institutional caution as investors rebalance their portfolios amid macro uncertainties. 

Bitcoin rebounded from $89,000 to $91,000 post-NVIDIA revenue announcement, which beat Wall Street’s expectations and pumped miners’ stocks.

Why is Bitcoin Up Today?

BTC Trading Volume
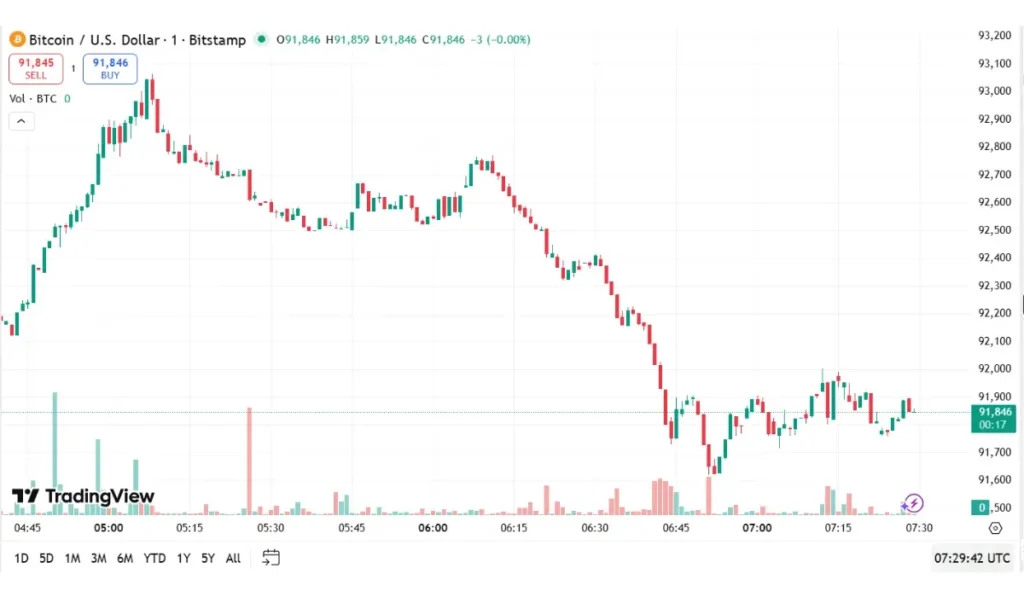
Source – TradingView

1. Nvidia Earnings Push Mining Stocks Higher (Bullish)

Chip manufacturing giant Nvidia’s Q3 2025 earnings beat expectations to hit $57 billion. This ignited a rally for Bitcoin mining stocks, with Cipher Mining and IREN leading gains at 13% and 10% respectively. Miners are increasingly pivoting to AI infrastructure, with IREN announcing a $9.7 billion deal with Microsoft Cloud and Cipher’s $5.5 billion partnership with Amazon.

This development is bullish for BTC as it validates miners’ diversification into high-value tech verticals like AI, potentially reducing sell pressure. However, rising debt for mining firms, like IREN’s GPU financing, and Bitcoin’s price sensitivity could strain profitability if the AI hype stabilizes.

2. Whale Accumulation and ETF Inflows (Bullish)

Bitcoin whale transactions surged to a yearly high. As per Glassnode data, the number of wallets holding over 1,000 BTC has increased since late October. Large holders transitioned from distribution to accumulation once the price closed in on $90,000, creating organic buy pressure. Analysts are signaling this as “smart money” buying BTC at a discount from panic sellers, especially the short-term holder cohort.

U.S. spot Bitcoin ETFs recorded $75.4 million in net inflows on November 19, with BlackRock’s IBIT accounting for $60.4 million of that total. This has reversed a bearish outflow trend from the previous week. Institutional capital returning after weeks of withdrawals has eased sell pressure. ETF flows remain sentiment-critical, with November witnessing +$1 billion in outflows.

3. Fed Policy Uncertainty (Mixed)

Bitcoin’s price recovery stalled as the U.S. jobs report release was delayed until November 20, while the odds of a rate cut by the Federal Reserve fell to 32%. Analysts are warning of a potential pullback to $80,000 if market liquidity remains tight. However, on-chain data shows that the $427 million loss suffered by short-term holders (STHs) signals a local bottom.

While this is bearish in the short term due to macroeconomic headwinds, it could turn bullish if positive jobs data sparks Fed dovishness.

4. Macro headwinds and ETF Outflows (Bearish)

BlackRock’s IBIT spot Bitcoin ETF experienced its largest daily outflow to date, at $523.15 million, on Tuesday, signaling institutional risk aversion. U.S. spot Bitcoin ETFs collectively shed $1.3 billion in assets over the past week as traditional markets continue to grapple with delayed Fed rate-cut expectations. Reduced institutional market participation weakened support.

5. Leverage Unwind and Liquidation Cascade (Bearish)

Bitcoin long liquidations hit $127 million in 24 hours, while total derivatives open interest spiked 10.4% to $889 million. This indicates that leveraged positions betting on the BTC price to rise were being forcibly closed. The Bitcoin Fear & Greed Index hit “extreme fear” levels at 15, the lowest score since March 2025.

High leverage increased losses as BTC broke below $90,000, with the 14-RSI at 37.95 showing “oversold” conditions, with no bullish reversal signals in sight. A sustained dip in funding rates below 0.004% could signal market capitulation.

Bitcoin (BTC) Price Technical Indicators

BTC rebounded from its $88,570 support zone, with 7-RSI hitting “oversold” levels at 23.5. The price recovery aligns with historical trend reversals for Bitcoin when RSI dips below 30. Oversold conditions and the $88,500 to $90,000 demand zone have triggered algorithmic buying and short-covering.

It is key for BTC to close above $90,000 and reclaim the $93,500 resistance for sustained momentum in November. This will be reflected through ETF inflows. 

Bitcoin (BTC) Price Prediction

Based on today’s technical indicators, we have predicted the minimum, average, and maximum rates at which Bitcoin (BTC) could change hands today and for the remainder of the year. Bear in mind that these numbers are subject to market volatility and macroeconomic factors.

BTC Price Today (Nov 20)

$BTC PriceMinimum Price (Nov 18) Average Price (Nov 18) Maximum Price (Nov 18) ROI
$92,543$88,500$90,000$92,949+3.28%

BTC Price 2025

MonthMinimum Price Average Price Maximum Price ROI
Nov 2025$92,949$95,331$98,000+5.72%
Dec 2025$92,408$94,570$97,328+5.01%

Final Thoughts on Bitcoin’s Price Today

Today’s surge in Bitcoin’s price reverses a week-long downtrend, which saw the apex crypto fall under the $90,000 mark for the first time since March 2025. The decline was largely driven by macro uncertainty, especially surrounding the U.S. government shutdown and lowered expectations of a Fed rate cut, which tightened liquidity, forcing traders to close leveraged long positions and institutional investors to exit from Bitcoin ETFs as a portfolio rebalancing measure.

However, BTC managed to reclaim the $90,000 level on Wednesday, outperforming the overall crypto market in the process. Nvidia’s Q3 revenue boosted mining stocks, and the return of ETF inflows, alongside increased whale accumulation at the $88,500 – $90,000 demand zone, have supported Bitcoin’s gains.

It is key for BTC to close above $90,000 and reclaim the $93,000 mark to sustain the bullish momentum.

The post Bitcoin Price Prediction Today (Nov 20): What’s Driving BTC Above $92K? appeared first on BiteMyCoin.

Disclaimer: The articles reposted on this site are sourced from public platforms and are provided for informational purposes only. They do not necessarily reflect the views of MEXC. All rights remain with the original authors. If you believe any content infringes on third-party rights, please contact service@support.mexc.com for removal. MEXC makes no guarantees regarding the accuracy, completeness, or timeliness of the content and is not responsible for any actions taken based on the information provided. The content does not constitute financial, legal, or other professional advice, nor should it be considered a recommendation or endorsement by MEXC.

You May Also Like

Developers of Altcoin Traded on Binance Reveal Reason for Major Price Drop – “Legal Process Has Begun”

Developers of Altcoin Traded on Binance Reveal Reason for Major Price Drop – “Legal Process Has Begun”

The post Developers of Altcoin Traded on Binance Reveal Reason for Major Price Drop – “Legal Process Has Begun” appeared on BitcoinEthereumNews.com. Private computing network Nillion explained that the sharp volatility seen in the NIL token price yesterday was caused by a market maker selling a large amount without authorization. The company stated that the party in question did not respond to any communication from the team during and after the sale. Nillion announced that it initiated a buyback process immediately following the incident, using funds from the treasury. It also stated that it had worked with exchanges to freeze accounts related to the sale and initiate legal action against the person or institution responsible. The company maintained that such unauthorized transactions occur from time to time in the crypto space, but that they would not remain passive this time. Nillion also announced that any funds recovered from the unauthorized token sales would be used for additional buybacks. NIL price has lost 36.3% of its value in the last 24 hours and is trading at $0.118 at the time of writing. Chart showing the decline in the price of NIL. NIL broke its all-time high price record at $0.95 about 8 months ago and is trading 87% lower than that record level at the time of writing. *This is not investment advice. Follow our Telegram and Twitter account now for exclusive news, analytics and on-chain data! Source: https://en.bitcoinsistemi.com/developers-of-altcoin-traded-on-binance-reveal-reason-for-major-price-drop-legal-process-has-begun/
Share
BitcoinEthereumNews2025/11/21 13:29
Crucial US Stock Market Update: What Wednesday’s Mixed Close Reveals

Crucial US Stock Market Update: What Wednesday’s Mixed Close Reveals

BitcoinWorld Crucial US Stock Market Update: What Wednesday’s Mixed Close Reveals The financial world often keeps us on our toes, and Wednesday was no exception. Investors watched closely as the US stock market concluded the day with a mixed performance across its major indexes. This snapshot offers a crucial glimpse into current investor sentiment and economic undercurrents, prompting many to ask: what exactly happened? Understanding the Latest US Stock Market Movements On Wednesday, the closing bell brought a varied picture for the US stock market. While some indexes celebrated gains, others registered slight declines, creating a truly mixed bag for investors. The Dow Jones Industrial Average showed resilience, climbing by a notable 0.57%. This positive movement suggests strength in some of the larger, more established companies. Conversely, the S&P 500, a broader benchmark often seen as a barometer for the overall market, experienced a modest dip of 0.1%. The technology-heavy Nasdaq Composite also saw a slight retreat, sliding by 0.33%. This particular index often reflects investor sentiment towards growth stocks and the tech sector. These divergent outcomes highlight the complex dynamics currently at play within the American economy. It’s not simply a matter of “up” or “down” for the entire US stock market; rather, it’s a nuanced landscape where different sectors and company types are responding to unique pressures and opportunities. Why Did the US Stock Market See Mixed Results? When the US stock market delivers a mixed performance, it often points to a tug-of-war between various economic factors. Several elements could have contributed to Wednesday’s varied closings. For instance, positive corporate earnings reports from certain industries might have bolstered the Dow. At the same time, concerns over inflation, interest rate policies by the Federal Reserve, or even global economic uncertainties could have pressured growth stocks, affecting the S&P 500 and Nasdaq. Key considerations often include: Economic Data: Recent reports on employment, manufacturing, or consumer spending can sway market sentiment. Corporate Announcements: Strong or weak earnings forecasts from influential companies can significantly impact their respective sectors. Interest Rate Expectations: The prospect of higher or lower interest rates directly influences borrowing costs for businesses and consumer spending, affecting future profitability. Geopolitical Events: Global tensions or trade policies can introduce uncertainty, causing investors to become more cautious. Understanding these underlying drivers is crucial for anyone trying to make sense of daily market fluctuations in the US stock market. Navigating Volatility in the US Stock Market A mixed close, while not a dramatic downturn, serves as a reminder that market volatility is a constant companion for investors. For those involved in the US stock market, particularly individuals managing their portfolios, these days underscore the importance of a well-thought-out strategy. It’s important not to react impulsively to daily movements. Instead, consider these actionable insights: Diversification: Spreading investments across different sectors and asset classes can help mitigate risk when one area underperforms. Long-Term Perspective: Focusing on long-term financial goals rather than short-term gains can help weather daily market swings. Stay Informed: Keeping abreast of economic news and company fundamentals provides context for market behavior. Consult Experts: Financial advisors can offer personalized guidance based on individual risk tolerance and objectives. Even small movements in major indexes can signal shifts that require attention, guiding future investment decisions within the dynamic US stock market. What’s Next for the US Stock Market? Looking ahead, investors will be keenly watching for further economic indicators and corporate announcements to gauge the direction of the US stock market. Upcoming inflation data, statements from the Federal Reserve, and quarterly earnings reports will likely provide more clarity. The interplay of these factors will continue to shape investor confidence and, consequently, the performance of the Dow, S&P 500, and Nasdaq. Remaining informed and adaptive will be key to understanding the market’s trajectory. Conclusion: Wednesday’s mixed close in the US stock market highlights the intricate balance of forces influencing financial markets. While the Dow showed strength, the S&P 500 and Nasdaq experienced slight declines, reflecting a nuanced economic landscape. This reminds us that understanding the ‘why’ behind these movements is as important as the movements themselves. As always, a thoughtful, informed approach remains the best strategy for navigating the complexities of the market. Frequently Asked Questions (FAQs) Q1: What does a “mixed close” mean for the US stock market? A1: A mixed close indicates that while some major stock indexes advanced, others declined. It suggests that different sectors or types of companies within the US stock market are experiencing varying influences, rather than a uniform market movement. Q2: Which major indexes were affected on Wednesday? A2: On Wednesday, the Dow Jones Industrial Average gained 0.57%, while the S&P 500 edged down 0.1%, and the Nasdaq Composite slid 0.33%, illustrating the mixed performance across the US stock market. Q3: What factors contribute to a mixed stock market performance? A3: Mixed performances in the US stock market can be influenced by various factors, including specific corporate earnings, economic data releases, shifts in interest rate expectations, and broader geopolitical events that affect different market segments uniquely. Q4: How should investors react to mixed market signals? A4: Investors are generally advised to maintain a long-term perspective, diversify their portfolios, stay informed about economic news, and avoid impulsive decisions. Consulting a financial advisor can also provide personalized guidance for navigating the US stock market. Q5: What indicators should investors watch for future US stock market trends? A5: Key indicators to watch include upcoming inflation reports, statements from the Federal Reserve regarding monetary policy, and quarterly corporate earnings reports. These will offer insights into the future direction of the US stock market. Did you find this analysis of the US stock market helpful? Share this article with your network on social media to help others understand the nuances of current financial trends! To learn more about the latest stock market trends, explore our article on key developments shaping the US stock market‘s future performance. This post Crucial US Stock Market Update: What Wednesday’s Mixed Close Reveals first appeared on BitcoinWorld.
Share
Coinstats2025/09/18 05:30