Bitcoin continues to struggle around the $90K level as the market battles intense selling pressure and widespread fear. Short-term sentiment remains fragile, with investors reacting to rapid price swings and mounting downside volatility. Yet, beneath the noise, key on-chain metrics are beginning to show signs that the correction may be nearing exhaustion. Related Reading: Nearly 7M Bitcoin Now Sitting At A Loss: Highest Unrealized Pain Since January 2024 According to analyst On-Chain Mind, Bitcoin’s Mean Reversion Oscillator has just printed its first green oversold bar in months, a signal that has historically aligned with late-stage retracements during bull markets. This oscillator measures how far price has deviated from its cyclical mean, helping identify when Bitcoin becomes overstretched to the downside. Each time this indicator dipped into its green oversold zone in previous cycles, Bitcoin was either forming a macro bottom or preparing for a significant rebound. The fact that this signal has appeared while BTC consolidates above $90K — despite severe profit-taking, forced liquidations, and structural fear — suggests that strong hands may be quietly absorbing supply. Historical Bottom Signals Align as Macro Tailwinds Strengthen On-Chain Mind explains that Bitcoin’s current Mean Reversion Oscillator reading aligns closely with historical patterns seen during bull market retracements. Each time the oscillator dipped into the green oversold zone while the 35 line held, Bitcoin formed a cyclical bottom before resuming its upward trajectory. This line has acted as a structural support level across multiple market cycles, and the fact that it is holding once again reinforces the idea that strong hands are stepping in as weaker participants capitulate. According to On-Chain Mind, when this indicator flashes green during an ongoing bull market, it often marks textbook accumulation territory — the kind of opportunity that appears only a few times per cycle. The current setup resembles previous late-stage pullbacks rather than the beginning of a prolonged bear trend. Adding to this outlook, NVIDIA’s blowout earnings delivered a major confidence boost to U.S. equities. With revenue and guidance far exceeding expectations, the results signal that AI-driven demand remains strong. In broader macro terms, such strength in tech leadership often spills over into higher-risk assets like crypto, improving liquidity and investor sentiment. Related Reading: Bitcoin Capitulation Deepens Around $90K Level: Classic Late-Stage Fear Structure Emerging Testing Support as Momentum Begins to Stabilize Bitcoin’s latest daily chart shows price attempting to stabilize after a sharp multi-week decline, with BTC currently trading near $92,000. This level is acting as a temporary support zone following the breakdown from the $100K area, where sellers aggressively dominated order books. The chart reveals a series of lower highs and lower lows — a classic short-term downtrend structure — but the recent candlesticks hint at reduced selling momentum compared to the peak pressure seen earlier in November. The 50-day and 100-day moving averages have both turned downward, reflecting weakening short-term trend strength, while the 200-day MA remains far below price, highlighting that the broader bullish cycle may not be invalidated yet. Importantly, the current candle structure shows smaller bodies and longer lower wicks, suggesting buyers are beginning to absorb sell-side liquidity around the $90K–$92K region. Related Reading: XRP Supply In Profit Falls to 58.5% – Lowest Since 2024 Despite Higher Price Volume profiles also support this shift. While capitulation-like spikes occurred during the heaviest drop, trading activity has now normalized, indicating panic selling is cooling off. Historically, such deceleration after a steep leg down often precedes a relief bounce, even if volatility persists. Featured image from ChatGPT, chart from TradingView.comBitcoin continues to struggle around the $90K level as the market battles intense selling pressure and widespread fear. Short-term sentiment remains fragile, with investors reacting to rapid price swings and mounting downside volatility. Yet, beneath the noise, key on-chain metrics are beginning to show signs that the correction may be nearing exhaustion. Related Reading: Nearly 7M Bitcoin Now Sitting At A Loss: Highest Unrealized Pain Since January 2024 According to analyst On-Chain Mind, Bitcoin’s Mean Reversion Oscillator has just printed its first green oversold bar in months, a signal that has historically aligned with late-stage retracements during bull markets. This oscillator measures how far price has deviated from its cyclical mean, helping identify when Bitcoin becomes overstretched to the downside. Each time this indicator dipped into its green oversold zone in previous cycles, Bitcoin was either forming a macro bottom or preparing for a significant rebound. The fact that this signal has appeared while BTC consolidates above $90K — despite severe profit-taking, forced liquidations, and structural fear — suggests that strong hands may be quietly absorbing supply. Historical Bottom Signals Align as Macro Tailwinds Strengthen On-Chain Mind explains that Bitcoin’s current Mean Reversion Oscillator reading aligns closely with historical patterns seen during bull market retracements. Each time the oscillator dipped into the green oversold zone while the 35 line held, Bitcoin formed a cyclical bottom before resuming its upward trajectory. This line has acted as a structural support level across multiple market cycles, and the fact that it is holding once again reinforces the idea that strong hands are stepping in as weaker participants capitulate. According to On-Chain Mind, when this indicator flashes green during an ongoing bull market, it often marks textbook accumulation territory — the kind of opportunity that appears only a few times per cycle. The current setup resembles previous late-stage pullbacks rather than the beginning of a prolonged bear trend. Adding to this outlook, NVIDIA’s blowout earnings delivered a major confidence boost to U.S. equities. With revenue and guidance far exceeding expectations, the results signal that AI-driven demand remains strong. In broader macro terms, such strength in tech leadership often spills over into higher-risk assets like crypto, improving liquidity and investor sentiment. Related Reading: Bitcoin Capitulation Deepens Around $90K Level: Classic Late-Stage Fear Structure Emerging Testing Support as Momentum Begins to Stabilize Bitcoin’s latest daily chart shows price attempting to stabilize after a sharp multi-week decline, with BTC currently trading near $92,000. This level is acting as a temporary support zone following the breakdown from the $100K area, where sellers aggressively dominated order books. The chart reveals a series of lower highs and lower lows — a classic short-term downtrend structure — but the recent candlesticks hint at reduced selling momentum compared to the peak pressure seen earlier in November. The 50-day and 100-day moving averages have both turned downward, reflecting weakening short-term trend strength, while the 200-day MA remains far below price, highlighting that the broader bullish cycle may not be invalidated yet. Importantly, the current candle structure shows smaller bodies and longer lower wicks, suggesting buyers are beginning to absorb sell-side liquidity around the $90K–$92K region. Related Reading: XRP Supply In Profit Falls to 58.5% – Lowest Since 2024 Despite Higher Price Volume profiles also support this shift. While capitulation-like spikes occurred during the heaviest drop, trading activity has now normalized, indicating panic selling is cooling off. Historically, such deceleration after a steep leg down often precedes a relief bounce, even if volatility persists. Featured image from ChatGPT, chart from TradingView.com

Bitcoin Mean Reversion Oscillator Prints First Green Oversold Bar in Months – A Classic Bull-Market Bottom Signal

2025/11/21 08:00

Bitcoin continues to struggle around the $90K level as the market battles intense selling pressure and widespread fear. Short-term sentiment remains fragile, with investors reacting to rapid price swings and mounting downside volatility. Yet, beneath the noise, key on-chain metrics are beginning to show signs that the correction may be nearing exhaustion.

According to analyst On-Chain Mind, Bitcoin’s Mean Reversion Oscillator has just printed its first green oversold bar in months, a signal that has historically aligned with late-stage retracements during bull markets. This oscillator measures how far price has deviated from its cyclical mean, helping identify when Bitcoin becomes overstretched to the downside.

Each time this indicator dipped into its green oversold zone in previous cycles, Bitcoin was either forming a macro bottom or preparing for a significant rebound. The fact that this signal has appeared while BTC consolidates above $90K — despite severe profit-taking, forced liquidations, and structural fear — suggests that strong hands may be quietly absorbing supply.

Historical Bottom Signals Align as Macro Tailwinds Strengthen

On-Chain Mind explains that Bitcoin’s current Mean Reversion Oscillator reading aligns closely with historical patterns seen during bull market retracements. Each time the oscillator dipped into the green oversold zone while the 35 line held, Bitcoin formed a cyclical bottom before resuming its upward trajectory. This line has acted as a structural support level across multiple market cycles, and the fact that it is holding once again reinforces the idea that strong hands are stepping in as weaker participants capitulate.
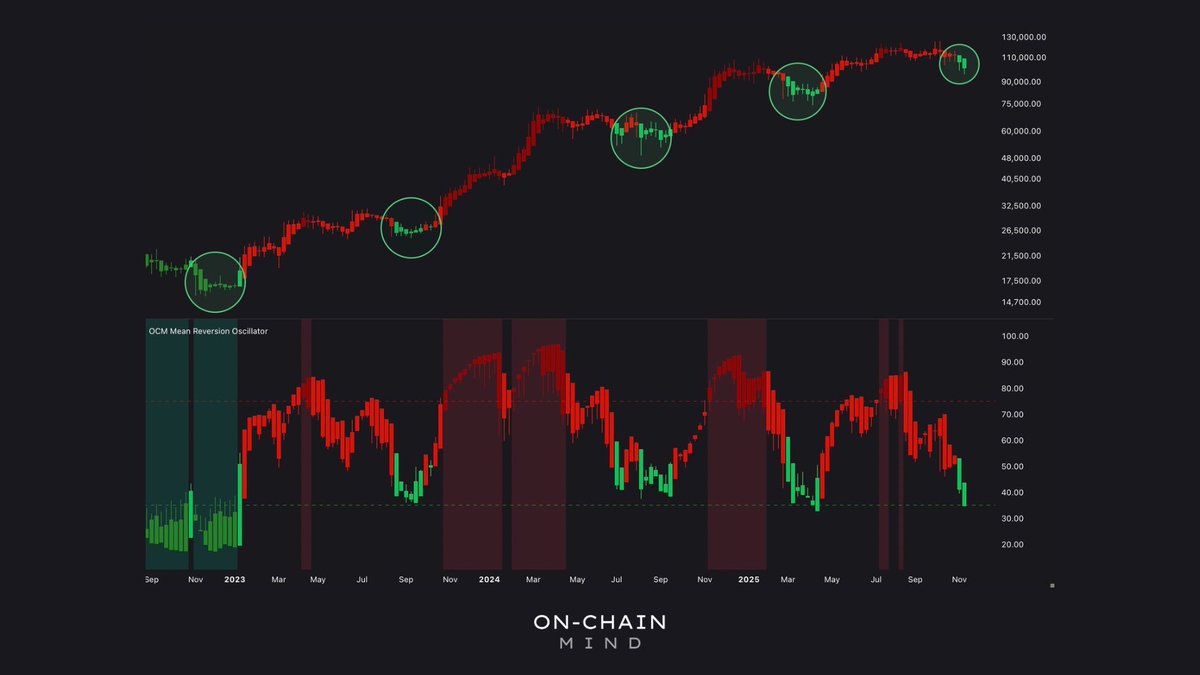
Mean Reversion Oscillator | Source: On-Chain Mind

According to On-Chain Mind, when this indicator flashes green during an ongoing bull market, it often marks textbook accumulation territory — the kind of opportunity that appears only a few times per cycle. The current setup resembles previous late-stage pullbacks rather than the beginning of a prolonged bear trend.

Adding to this outlook, NVIDIA’s blowout earnings delivered a major confidence boost to U.S. equities. With revenue and guidance far exceeding expectations, the results signal that AI-driven demand remains strong. In broader macro terms, such strength in tech leadership often spills over into higher-risk assets like crypto, improving liquidity and investor sentiment.

Testing Support as Momentum Begins to Stabilize

Bitcoin’s latest daily chart shows price attempting to stabilize after a sharp multi-week decline, with BTC currently trading near $92,000. This level is acting as a temporary support zone following the breakdown from the $100K area, where sellers aggressively dominated order books.

The chart reveals a series of lower highs and lower lows — a classic short-term downtrend structure — but the recent candlesticks hint at reduced selling momentum compared to the peak pressure seen earlier in November.

BTC testing fresh lows | Source: BTCUSDT chart on TradingView

The 50-day and 100-day moving averages have both turned downward, reflecting weakening short-term trend strength, while the 200-day MA remains far below price, highlighting that the broader bullish cycle may not be invalidated yet. Importantly, the current candle structure shows smaller bodies and longer lower wicks, suggesting buyers are beginning to absorb sell-side liquidity around the $90K–$92K region.

Volume profiles also support this shift. While capitulation-like spikes occurred during the heaviest drop, trading activity has now normalized, indicating panic selling is cooling off. Historically, such deceleration after a steep leg down often precedes a relief bounce, even if volatility persists.

Featured image from ChatGPT, chart from TradingView.com

Disclaimer: The articles reposted on this site are sourced from public platforms and are provided for informational purposes only. They do not necessarily reflect the views of MEXC. All rights remain with the original authors. If you believe any content infringes on third-party rights, please contact service@support.mexc.com for removal. MEXC makes no guarantees regarding the accuracy, completeness, or timeliness of the content and is not responsible for any actions taken based on the information provided. The content does not constitute financial, legal, or other professional advice, nor should it be considered a recommendation or endorsement by MEXC.

You May Also Like

Polymarket, Kalshi bet big on web3—and global expansion

Polymarket, Kalshi bet big on web3—and global expansion

The post Polymarket, Kalshi bet big on web3—and global expansion appeared on BitcoinEthereumNews.com. Polymarket and Kalshi are doubling down on their future — literally — as both prediction-market platforms push into web3 and global markets in search of new revenue streams. Both startups are also on the hunt for regulatory approvals, and partnerships with sports organizations. Summary Polymarket and Kalshi reportedly kicked off expansion efforts. The plans were unveiled at a private New York dinner attended by ICE CEO Jeffrey Sprecher. Both platforms are exploring decentralized technologies and international venue partnerships as trading volumes rise. Bloomberg reports the expansion was kicked off in classic Wall Street fashion: with a private dinner high above New York’s financial district, where even Intercontinental Exchange CEO Jeffrey Sprecher showed up. Why it matters Both companies have been ramping up their growth strategies, each aiming to break out of their current lanes. Polymarket, which is about to relaunch in the U.S., and Kalshi, which just partnered with Coinbase, are now circling opportunities in web3 technologies — essentially taking prediction markets from the basement of the internet to the broader blockchain universe. As trading volumes rise, regulators and institutional players have been paying much closer attention to the sector — and so is big tech. Alphabet, for example, will soon display live probabilities from Kalshi and Polymarket on Google Finance and Google Search. This will allow users to type natural-language questions such as “Will the Fed cut rates in December?” and instantly see odds and how they’ve shifted over time. Kalshi supplies regulated U.S. event markets tied to economic data and policy decisions, while Polymarket covers a wider global range of topics, including politics, sports, and crypto. Both platforms have seen rising activity as more traders rely on prediction markets to assess future outcomes rather than traditional polls or analyst forecasts. Still, details on specific deals or regulatory filings…
Share
BitcoinEthereumNews2025/11/21 10:27
Why are XRP, BTC, ETH, and DOGE Prices Crashing?

Why are XRP, BTC, ETH, and DOGE Prices Crashing?

The post Why are XRP, BTC, ETH, and DOGE Prices Crashing? appeared on BitcoinEthereumNews.com. XRP, BTC, ETH, and DOGE prices are experiencing significant declines, with the overall crypto market down 2.71% in the past 24 hours. Bitcoin has fallen below $90K, and Ethereum dropped under $3K, contributing to a broader market downturn. XRP Price Struggles as Price Dips Below $2 In the last 24 hours, the XRP price crashed by 2% and it has reduced by 15% in the current week, at a lower price of less than $2 in a bearish market. The price of the cryptocurrency is presented in the form of a descending triangle, which is indicative of the risk of a further decrease. A breakdown of major support lines added to the decline in the recent past, leading to stop-losses and a minor spurt of leveraged sell-side liquidations. Moreover, the whale action increased with 190 million XRP being sold within the past 48 hours. In the meantime, there is a Bitwise XRP ETF that has been launched, but the situation is unstable in the market. 190 million $XRP sold by whales in the last 48 hours! pic.twitter.com/nB0P7jADCx — Ali (@ali_charts) November 20, 2025 Bitcoin Price Plunges, Falling Below $90K Amid Market Sell-Off Bitcoin price dropped 2.24% to $86,858 over the past 24 hours, continuing a 12% weekly decline. The BTC was selling at a low of less than $90k as investor confidence shifted to the negative. Redemptions of Bitcoin ETFs amounted to a sharp decline of $3.3 billion this month, which further contributed to the negative pressure. Also, the Federal Reserve rate cut in December was in doubt, with the probability being now 33% and this burdened risk assets.  BTC also sent down vital support levels, causing automated selling. The recent better-than-anticipated jobs report in United States sparked a question as to what Fed would do in future. Ethereum Price…
Share
BitcoinEthereumNews2025/11/21 10:29
Music body ICMP laments “wilful” theft of artists’ work

Music body ICMP laments “wilful” theft of artists’ work

The post Music body ICMP laments “wilful” theft of artists’ work appeared on BitcoinEthereumNews.com. A major music industry group, ICMP, has lamented the use of artists’ work by AI companies, calling them guilty of “wilful” copyright infringement, as the battle between the tech firms and the arts industry continues. The Brussels-based group known as the International Confederation of Music Publishers (ICMP) comprises major record labels and other music industry professionals. Their voice adds to many others within the arts industry that have expressed displeasure at AI firms for using their creative work to train their systems without permission. ICMP accuses AI firms of deliberate copyright infringement ICMP director general John Phelan told AFP that big tech firms and AI-specific companies were involved in what he termed “the largest copyright infringement exercise that has been seen.” He cited the likes of OpenAI, Suno, Udio, and Mistral as some of the culprits. The ICMP carried out an investigation for nearly two years to ascertain how generative AI firms were using material by creatives to enrich themselves. The Brussels-based group is one of a number of industry bodies that span across news media and publishing to target the fast-growing AI sector over its use of content without paying any royalties. Suno and Udio, who are AI music generators, can produce tracks with voices, melodies, and musical styles that echo those of the original artists such as the Beatles, Depeche Mode, Mariah Carey, and the Beach boys. “What is legal or illegal is how the technologies are used. That means the corporate decisions made by the chief executives of companies matter immensely and should comply with the law,” Phelan told AFP. “What we see is they are engaged in wilful, commercial-scale copyright infringement.” Phelan. In June last year, a US trade group, the Recording Industry Association of America, filed a lawsuit against Suno and Udio. However, an exception…
Share
BitcoinEthereumNews2025/09/18 04:41