Bitcoin is currently trading below $92,000, and the market is showing clear signs of exhaustion as selling pressure intensifies. Fear has pushed sentiment toward the bearish end of the spectrum, with many analysts now arguing that BTC may be entering a new bear market. The loss of key support levels and the rapid acceleration of downside volatility have only fueled these concerns, especially as short-term holders continue to capitulate at scale. Related Reading: Bitcoin Capitulation Deepens Around $90K Level: Classic Late-Stage Fear Structure Emerging However, not all perspectives are bearish. Some analysts believe that Bitcoin may be forming a local bottom, as the current correction resembles previous mid-cycle retracements seen during strong bull markets. They argue that the broader macro environment remains supportive and that long-term holders have not shown signs of structural weakness. As selling pressure concentrates among weak hands, the possibility of a reversal increases — especially once forced sellers exhaust themselves. Adding to the uncertainty, new on-chain data from Lookonchain revealed that Bitcoin OG Owen Gunden just deposited all his remaining 2,499 BTC into Kraken roughly an hour ago. Moves like this often trigger speculation, as exchange deposits from early holders can signal potential selling. Yet historically, similar events have also occurred near cycle bottoms when panic is at its peak. A Massive BTC Transfer Sparks Market Speculation According to fresh data from Lookonchain, Bitcoin OG Owen Gunden has just deposited his remaining 2,499 BTC (worth $228 million) into Kraken roughly an hour ago. This move has immediately raised questions across the market, as large exchange deposits from early whales often signal potential selling pressure. What makes this development even more notable is the context: just two weeks ago, Lookonchain reported that Gunden appeared ready to offload his entire 11,000 BTC stash — a position worth over $1.12 billion at the time. Now, with this final deposit, it appears he has officially completed the move. For many traders, this confirms that one of the oldest and largest long-term holders has fully exited or is preparing to exit the market. Such whale behavior can amplify fear during corrective phases, especially as Bitcoin continues to struggle below $92K. Moves of this scale not only contribute to short-term volatility but also influence sentiment by signaling that even early accumulators may be reducing exposure. However, historically, capitulation events from long-term holders have often coincided with or preceded major turning points. If this massive transfer marks the end of Gunden’s sell-off, the market may soon absorb the pressure — potentially clearing the path for a recovery once the fear subsides. Related Reading: Nearly 7M Bitcoin Now Sitting At A Loss: Highest Unrealized Pain Since January 2024 Short-Term Trend Still Under Pressure Bitcoin’s 4-hour chart reveals a market that remains firmly under short-term selling pressure, despite occasional relief bounces. The price is struggling to reclaim $92,000, a level that previously acted as support but is now working as resistance. The series of lower highs and lower lows highlights a persistent downtrend that has shaped BTC’s trajectory since early October. All major moving averages—the 50 SMA, 100 SMA, and 200 SMA—are positioned above current price action and pointing downward. This alignment confirms a clear short-term bearish structure. Each time BTC attempts to recover, it meets strong resistance at these declining MAs, signaling that sellers remain in control. The most recent bounce barely reached the 50 SMA before being rejected again, reinforcing the weakness of buyer momentum. Related Reading: XRP Supply In Profit Falls to 58.5% – Lowest Since 2024 Despite Higher Price Volume remains elevated on downswings, which indicates that sell-offs continue to be driven by conviction rather than random volatility. Buyers are stepping in around the $89,000–$91,000 zone, but so far, this support has only produced temporary pauses rather than meaningful reversals. For a structural shift, BTC would need to reclaim at least the $95,000 area and break above the 100 SMA. Until then, the trend remains tilted toward further downside or continued consolidation near current levels. Featured image from ChatGPT, chart from TradingView.comBitcoin is currently trading below $92,000, and the market is showing clear signs of exhaustion as selling pressure intensifies. Fear has pushed sentiment toward the bearish end of the spectrum, with many analysts now arguing that BTC may be entering a new bear market. The loss of key support levels and the rapid acceleration of downside volatility have only fueled these concerns, especially as short-term holders continue to capitulate at scale. Related Reading: Bitcoin Capitulation Deepens Around $90K Level: Classic Late-Stage Fear Structure Emerging However, not all perspectives are bearish. Some analysts believe that Bitcoin may be forming a local bottom, as the current correction resembles previous mid-cycle retracements seen during strong bull markets. They argue that the broader macro environment remains supportive and that long-term holders have not shown signs of structural weakness. As selling pressure concentrates among weak hands, the possibility of a reversal increases — especially once forced sellers exhaust themselves. Adding to the uncertainty, new on-chain data from Lookonchain revealed that Bitcoin OG Owen Gunden just deposited all his remaining 2,499 BTC into Kraken roughly an hour ago. Moves like this often trigger speculation, as exchange deposits from early holders can signal potential selling. Yet historically, similar events have also occurred near cycle bottoms when panic is at its peak. A Massive BTC Transfer Sparks Market Speculation According to fresh data from Lookonchain, Bitcoin OG Owen Gunden has just deposited his remaining 2,499 BTC (worth $228 million) into Kraken roughly an hour ago. This move has immediately raised questions across the market, as large exchange deposits from early whales often signal potential selling pressure. What makes this development even more notable is the context: just two weeks ago, Lookonchain reported that Gunden appeared ready to offload his entire 11,000 BTC stash — a position worth over $1.12 billion at the time. Now, with this final deposit, it appears he has officially completed the move. For many traders, this confirms that one of the oldest and largest long-term holders has fully exited or is preparing to exit the market. Such whale behavior can amplify fear during corrective phases, especially as Bitcoin continues to struggle below $92K. Moves of this scale not only contribute to short-term volatility but also influence sentiment by signaling that even early accumulators may be reducing exposure. However, historically, capitulation events from long-term holders have often coincided with or preceded major turning points. If this massive transfer marks the end of Gunden’s sell-off, the market may soon absorb the pressure — potentially clearing the path for a recovery once the fear subsides. Related Reading: Nearly 7M Bitcoin Now Sitting At A Loss: Highest Unrealized Pain Since January 2024 Short-Term Trend Still Under Pressure Bitcoin’s 4-hour chart reveals a market that remains firmly under short-term selling pressure, despite occasional relief bounces. The price is struggling to reclaim $92,000, a level that previously acted as support but is now working as resistance. The series of lower highs and lower lows highlights a persistent downtrend that has shaped BTC’s trajectory since early October. All major moving averages—the 50 SMA, 100 SMA, and 200 SMA—are positioned above current price action and pointing downward. This alignment confirms a clear short-term bearish structure. Each time BTC attempts to recover, it meets strong resistance at these declining MAs, signaling that sellers remain in control. The most recent bounce barely reached the 50 SMA before being rejected again, reinforcing the weakness of buyer momentum. Related Reading: XRP Supply In Profit Falls to 58.5% – Lowest Since 2024 Despite Higher Price Volume remains elevated on downswings, which indicates that sell-offs continue to be driven by conviction rather than random volatility. Buyers are stepping in around the $89,000–$91,000 zone, but so far, this support has only produced temporary pauses rather than meaningful reversals. For a structural shift, BTC would need to reclaim at least the $95,000 area and break above the 100 SMA. Until then, the trend remains tilted toward further downside or continued consolidation near current levels. Featured image from ChatGPT, chart from TradingView.com

Bitcoin OG Owen Gunden Deposits Final 2,499 BTC ($228M) to Kraken – Details

2025/11/21 10:00

Bitcoin is currently trading below $92,000, and the market is showing clear signs of exhaustion as selling pressure intensifies. Fear has pushed sentiment toward the bearish end of the spectrum, with many analysts now arguing that BTC may be entering a new bear market. The loss of key support levels and the rapid acceleration of downside volatility have only fueled these concerns, especially as short-term holders continue to capitulate at scale.

However, not all perspectives are bearish. Some analysts believe that Bitcoin may be forming a local bottom, as the current correction resembles previous mid-cycle retracements seen during strong bull markets. They argue that the broader macro environment remains supportive and that long-term holders have not shown signs of structural weakness. As selling pressure concentrates among weak hands, the possibility of a reversal increases — especially once forced sellers exhaust themselves.

Adding to the uncertainty, new on-chain data from Lookonchain revealed that Bitcoin OG Owen Gunden just deposited all his remaining 2,499 BTC into Kraken roughly an hour ago. Moves like this often trigger speculation, as exchange deposits from early holders can signal potential selling. Yet historically, similar events have also occurred near cycle bottoms when panic is at its peak.

A Massive BTC Transfer Sparks Market Speculation

According to fresh data from Lookonchain, Bitcoin OG Owen Gunden has just deposited his remaining 2,499 BTC (worth $228 million) into Kraken roughly an hour ago. This move has immediately raised questions across the market, as large exchange deposits from early whales often signal potential selling pressure.
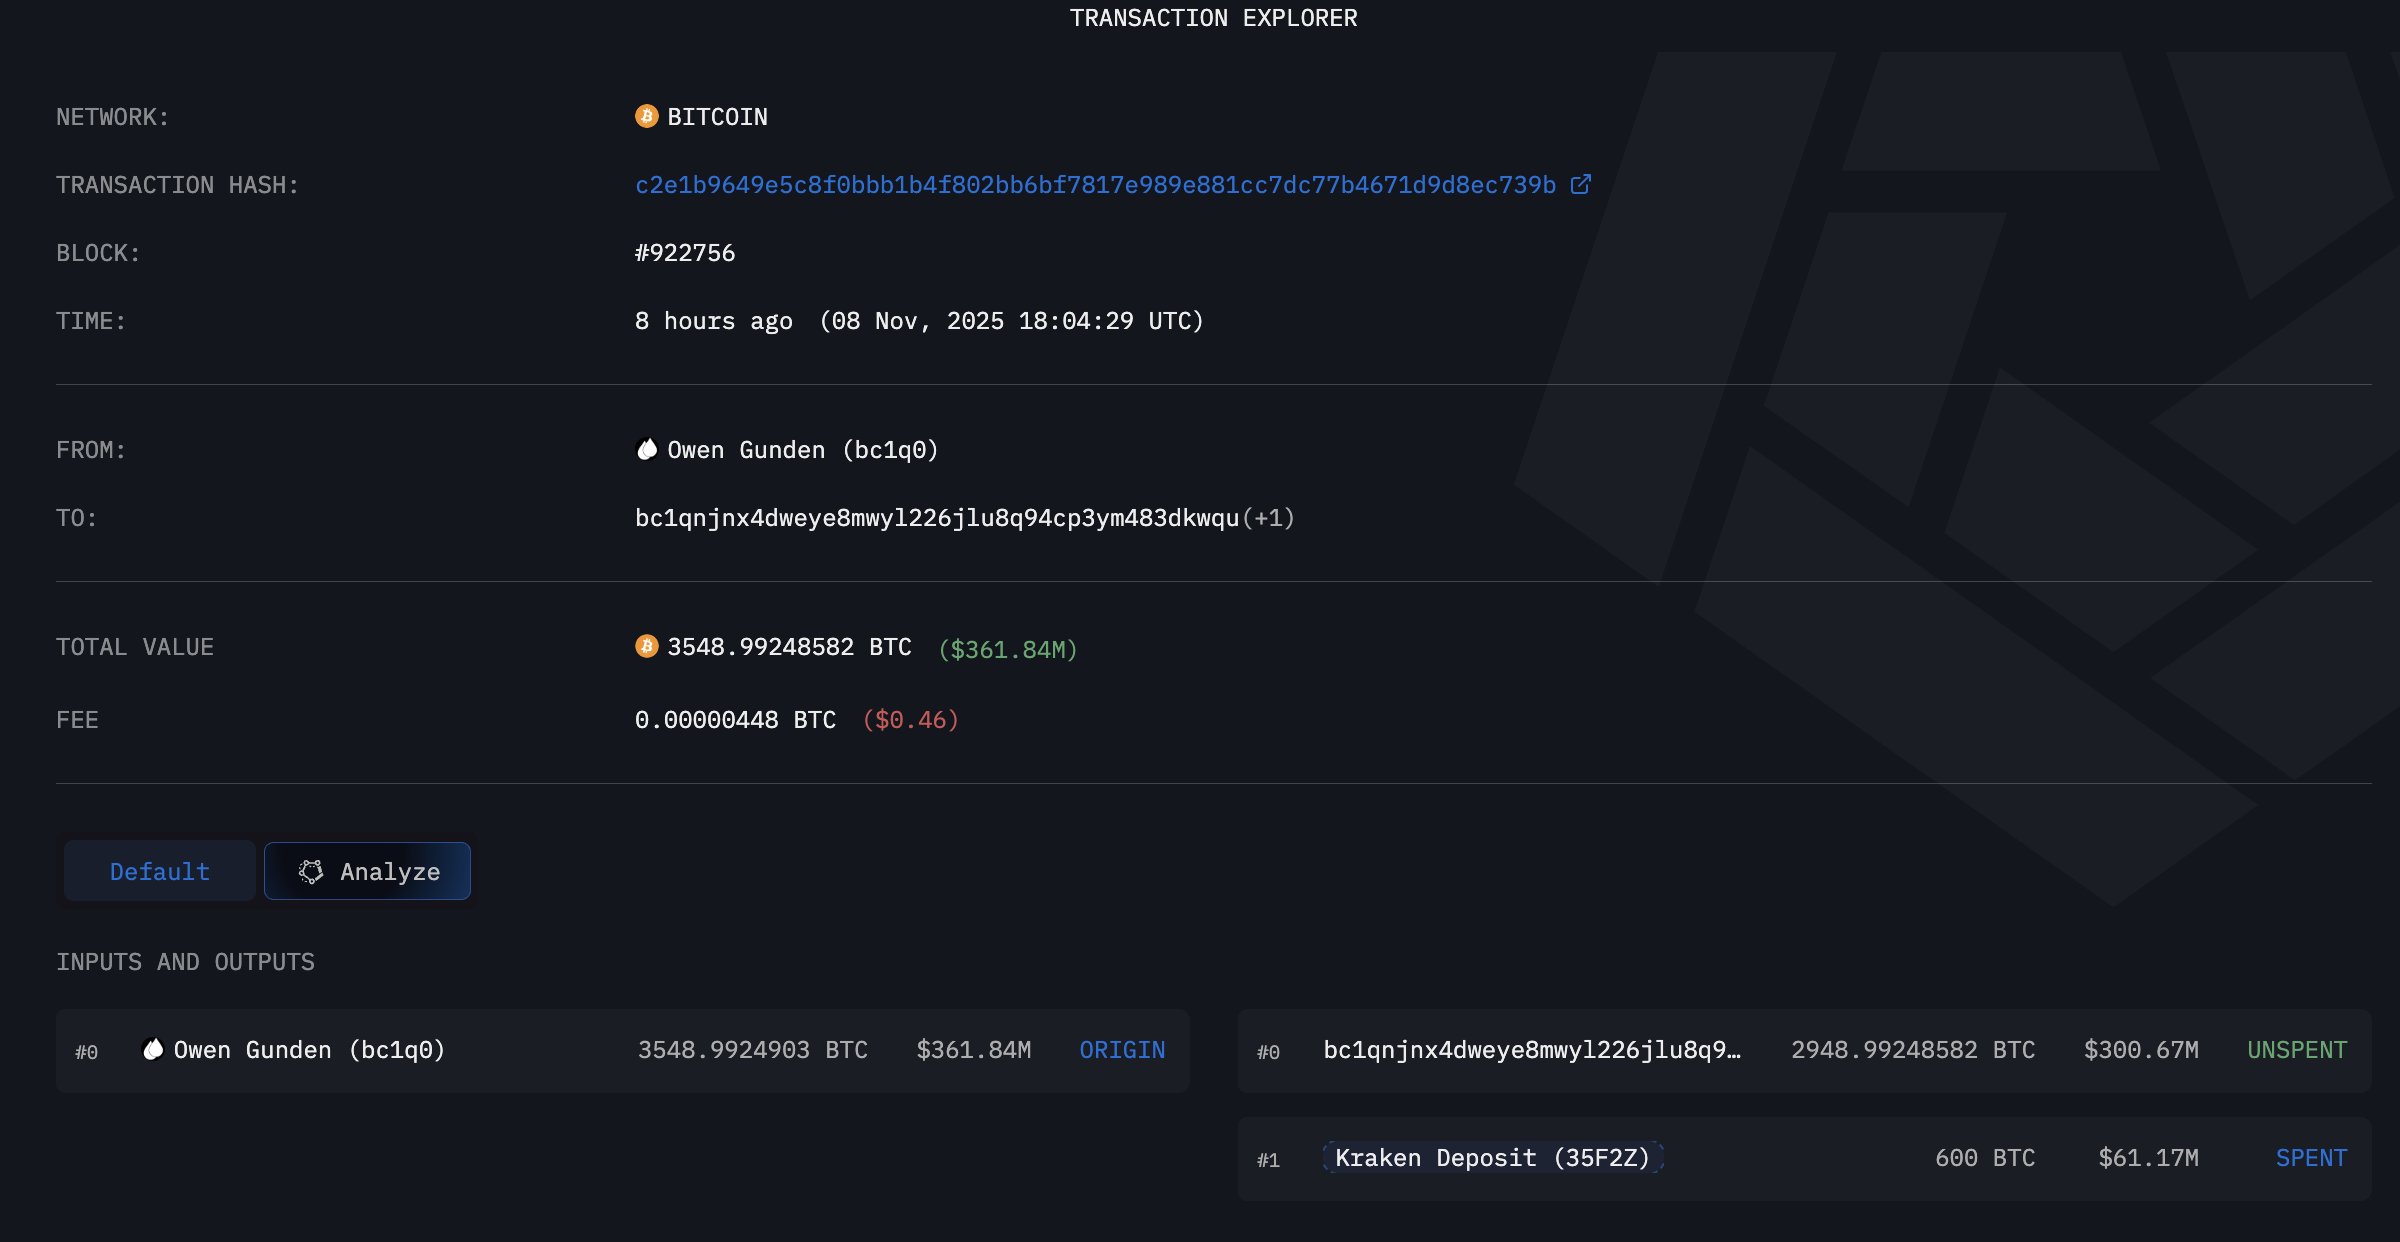
Owen Gunden Bitcoin Transaction | Source: Lookonchain

What makes this development even more notable is the context: just two weeks ago, Lookonchain reported that Gunden appeared ready to offload his entire 11,000 BTC stash — a position worth over $1.12 billion at the time. Now, with this final deposit, it appears he has officially completed the move.

For many traders, this confirms that one of the oldest and largest long-term holders has fully exited or is preparing to exit the market. Such whale behavior can amplify fear during corrective phases, especially as Bitcoin continues to struggle below $92K. Moves of this scale not only contribute to short-term volatility but also influence sentiment by signaling that even early accumulators may be reducing exposure.

However, historically, capitulation events from long-term holders have often coincided with or preceded major turning points. If this massive transfer marks the end of Gunden’s sell-off, the market may soon absorb the pressure — potentially clearing the path for a recovery once the fear subsides.

Short-Term Trend Still Under Pressure

Bitcoin’s 4-hour chart reveals a market that remains firmly under short-term selling pressure, despite occasional relief bounces. The price is struggling to reclaim $92,000, a level that previously acted as support but is now working as resistance. The series of lower highs and lower lows highlights a persistent downtrend that has shaped BTC’s trajectory since early October.

BTC testing fresh demand level | Source: BTCUSDT chart on TradingView

All major moving averages—the 50 SMA, 100 SMA, and 200 SMA—are positioned above current price action and pointing downward. This alignment confirms a clear short-term bearish structure. Each time BTC attempts to recover, it meets strong resistance at these declining MAs, signaling that sellers remain in control. The most recent bounce barely reached the 50 SMA before being rejected again, reinforcing the weakness of buyer momentum.

Volume remains elevated on downswings, which indicates that sell-offs continue to be driven by conviction rather than random volatility. Buyers are stepping in around the $89,000–$91,000 zone, but so far, this support has only produced temporary pauses rather than meaningful reversals.

For a structural shift, BTC would need to reclaim at least the $95,000 area and break above the 100 SMA. Until then, the trend remains tilted toward further downside or continued consolidation near current levels.

Featured image from ChatGPT, chart from TradingView.com

Disclaimer: The articles reposted on this site are sourced from public platforms and are provided for informational purposes only. They do not necessarily reflect the views of MEXC. All rights remain with the original authors. If you believe any content infringes on third-party rights, please contact service@support.mexc.com for removal. MEXC makes no guarantees regarding the accuracy, completeness, or timeliness of the content and is not responsible for any actions taken based on the information provided. The content does not constitute financial, legal, or other professional advice, nor should it be considered a recommendation or endorsement by MEXC.

You May Also Like

Developers of Altcoin Traded on Binance Reveal Reason for Major Price Drop – “Legal Process Has Begun”

Developers of Altcoin Traded on Binance Reveal Reason for Major Price Drop – “Legal Process Has Begun”

The post Developers of Altcoin Traded on Binance Reveal Reason for Major Price Drop – “Legal Process Has Begun” appeared on BitcoinEthereumNews.com. Private computing network Nillion explained that the sharp volatility seen in the NIL token price yesterday was caused by a market maker selling a large amount without authorization. The company stated that the party in question did not respond to any communication from the team during and after the sale. Nillion announced that it initiated a buyback process immediately following the incident, using funds from the treasury. It also stated that it had worked with exchanges to freeze accounts related to the sale and initiate legal action against the person or institution responsible. The company maintained that such unauthorized transactions occur from time to time in the crypto space, but that they would not remain passive this time. Nillion also announced that any funds recovered from the unauthorized token sales would be used for additional buybacks. NIL price has lost 36.3% of its value in the last 24 hours and is trading at $0.118 at the time of writing. Chart showing the decline in the price of NIL. NIL broke its all-time high price record at $0.95 about 8 months ago and is trading 87% lower than that record level at the time of writing. *This is not investment advice. Follow our Telegram and Twitter account now for exclusive news, analytics and on-chain data! Source: https://en.bitcoinsistemi.com/developers-of-altcoin-traded-on-binance-reveal-reason-for-major-price-drop-legal-process-has-begun/
Share
BitcoinEthereumNews2025/11/21 13:29
XRP Price Extends Losses, Deepens Move Below $2.0 Amid Softer Sentiment

XRP Price Extends Losses, Deepens Move Below $2.0 Amid Softer Sentiment

XRP price started a fresh decline below $2.050. The price is now struggling and faces resistance near the $2.050 pivot level. XRP price started a fresh decline below the $2.050 zone. The price is now trading below $2.050 and the 100-hourly Simple Moving Average. There is a bearish trend line forming with resistance at $2.080 on the hourly chart of the XRP/USD pair (data source from Kraken). The pair could continue to move down if it settles below $2.00. XRP Price Dips Further XRP price attempted a recovery wave above $2.120 but failed to continue higher, like Bitcoin and Ethereum. The price started a fresh decline below $2.050 and $2.020. There was a move below the $2.00 support level. A low was formed at $1.957, and the price is now consolidating losses below the 23.6% Fib retracement level of the downward move from the $2.141 swing high to the $1.9575 low. The price is now trading below $2.050 and the 100-hourly Simple Moving Average. If there is a fresh upward move, the price might face resistance near the $2.050 level and the 50% Fib retracement level of the downward move from the $2.141 swing high to the $1.9575 low. The first major resistance is near the $2.080 level. There is also a bearish trend line forming with resistance at $2.080 on the hourly chart of the XRP/USD pair. A close above $2.080 could send the price to $2.120. The next hurdle sits at $2.150. A clear move above the $2.150 resistance might send the price toward the $2.20 resistance. Any more gains might send the price toward the $2.250 resistance. The next major hurdle for the bulls might be near $2.320. More Losses? If XRP fails to clear the $2.080 resistance zone, it could start a fresh decline. Initial support on the downside is near the $1.950 level. The next major support is near the $1.920 level. If there is a downside break and a close below the $1.920 level, the price might continue to decline toward $1.880. The next major support sits near the $1.8450 zone, below which the price could continue lower toward $1.80. Technical Indicators Hourly MACD – The MACD for XRP/USD is now gaining pace in the bearish zone. Hourly RSI (Relative Strength Index) – The RSI for XRP/USD is now below the 50 level. Major Support Levels – $1.950 and $1.920. Major Resistance Levels – $2.050 and $2.080.
Share
NewsBTC2025/11/21 12:48