

dogwifhat (WIF) Price Prediction 2025, 2026-2030
- Bullish WIF price prediction for 2025 is $1.398 to $2.735.
- dogwifhat (WIF) price might reach $5 soon.
- Bearish WIF price prediction for 2025 is $0.305.
In this dogwifhat (WIF) price prediction 2025, 2026-2030, we will analyze the price patterns of WIF by using accurate trader-friendly technical analysis indicators and predict the future movement of the cryptocurrency.
|
TABLE OF CONTENTS
|
|
INTRODUCTION
|
|
|
DOGWIFHAT (WIF) PRICE PREDICTION 2025
|
|
| DOGWIFHAT (WIF) PRICE PREDICTION 2026, 2027-2030 |
| CONCLUSION |
| FAQ |
dogwifhat (WIF) Current Market Status
| Current Price | $0.3785 |
| 24 – Hour Price Change | 0.94% Down |
| 24 – Hour Trading Volume | $183.57M |
| Market Cap | $378.08M |
| Circulating Supply | 998.83M WIF |
| All – Time High | $4.85 (On Mar 31, 2024) |
| All – Time Low | $0.00002344 (On Nov 21, 2023) |
What is dogwifhat (WIF)?
| TICKER | WIF |
| BLOCKCHAIN | Solana |
| CATEGORY | Meme coin |
| LAUNCHED ON | November 2023 |
With a market cap of around $4 billion, Dogwifhat (WIF) is now the third biggest meme coin after DOGE and SHIB – a feat it achieved within four months of its launch. The project’s success is attributed to its catchy meme concept of a dog wearing a hat.
Additionally, WIF’s rise has also positively impacted Solana’s recovery, as investors had to buy SOL to convert it into WIF. Further, the community’s ambitious fundraising campaign to display their meme on the Las Vegas Sphere raised nearly $700,000.
WIF 24H Technicals
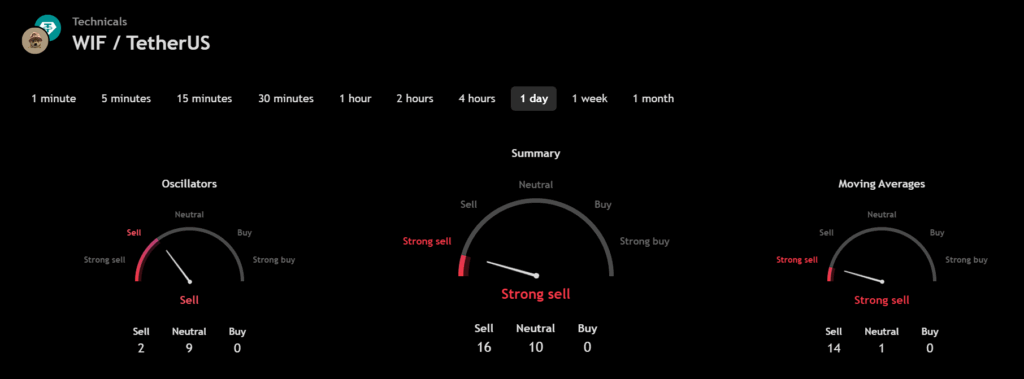 (Source: TradingView)
dogwifhat (WIF) Price Prediction 2025
dogwifhat (WIF) ranks 118th on CoinMarketCap in terms of its market capitalization. The overview of the WIF price prediction for 2025 is explained below with a daily time frame.
In the above chart, dogwifhat (WIF) laid out a Ascending Triangle pattern The ascending triangle is a characteristic pattern of an ongoing bullish trend. This triangle is formed by a horizontal upper trendline that connects the highs, indicating a consistent level of resistance, and a lower trendline that connects the rising lows, reflecting increasing buying pressure.
As the price approaches the apex of the triangle, the tension between buyers and sellers intensifies. If the trend breaks out at the resistance level, the price will continue to move up in this ascending triangle pattern, often leading to further gains. Traders typically look for confirmation of the breakout, which can enhance the likelihood of a successful upward move.
At the time of analysis, dogwifhat (WIF) was recorded at $0.3785. If the pattern trend continues, then the price of WIF might reach the resistance levels of $1.323 and $2.697. If the trend reverses, then the price of WIF may fall to the support levels of $1.002 (breached) and $0.643.
dogwifhat (WIF) Resistance and Support Levels
The chart given below elucidates the possible resistance and support levels of dogwifhat (WIF) in 2025.
From the above chart, we can analyze and identify the following as resistance and support levels of dogwifhat (WIF) for 2025.
| Resistance Level 1 | $1.398 |
| Resistance Level 2 | $2.735 |
| Support Level 1 | $0.755 |
| Support Level 2 | $0.305 |
dogwifhat (WIF) Price Prediction 2025 — RVOL, MA, and RSI
The technical analysis indicators such as Relative Volume (RVOL), Moving Average (MA), and Relative Strength Index (RSI) of dogwifhat (WIF) are shown in the chart below.
From the readings on the chart above, we can make the following inferences regarding the current dogwifhat (WIF) market in 2025.
| INDICATOR | PURPOSE | READING | INFERENCE |
| 50-Day Moving Average (50MA) | Nature of the current trend by comparing the average price over 50 days | 50 MA = $0.930 Price = $1.073 (50MA < Price) | Bullish/Uptrend |
| Relative Strength Index (RSI) | Magnitude of price change;Analyzing oversold & overbought conditions | 52.971 <30 = Oversold 50-70 = Neutral >70 = Overbought | Neutral |
| Relative Volume (RVOL) | Asset’s trading volume in relation to its recent average volumes | Below cutoff line | Weak Volume |
dogwifhat (WIF) Price Prediction 2025 — ADX, RVI
In the below chart, we analyze the strength and volatility of dogwifhat (WIF) using the following technical analysis indicators — Average Directional Index (ADX) and Relative Volatility Index (RVI).
From the readings on the chart above, we can make the following inferences regarding the price momentum of dogwifhat (WIF).
| INDICATOR | PURPOSE | READING | INFERENCE |
| Average Directional Index (ADX) | Strength of the trend momentum | 28.963 | Weak Trend |
| Relative Volatility Index (RVI) | Volatility over a specific period | 58.72 <50 = Low >50 = High | High Volatility |
Comparison of WIF with BTC, ETH
Let us now compare the price movements of dogwifhat (WIF) with those of Bitcoin (BTC) and Ethereum (ETH).
From the above chart, the price action of WIF is dissimilar to that of BTC and ETH. That is, when the price of BTC and ETH increases, the price of WIF decreases; if the price of BTC and ETH decreases, the price of WIF increases.
dogwifhat (WIF) Price Prediction 2026, 2027 – 2030
With the help of the aforementioned technical analysis indicators and trend patterns, let us predict the price of dogwifhat (WIF) between 2026, 2027, 2028, 2029, and 2030.
| Year | Bullish Price | Bearish Price |
| dogwifhat (WIF) Price Prediction 2026 | $7 | $0.2 |
| dogwifhat (WIF) Price Prediction 2027 | $9 | $0.1 |
| dogwifhat (WIF) Price Prediction 2028 | $11 | $0.09 |
| dogwifhat (WIF) Price Prediction 2029 | $13 | $0.08 |
| dogwifhat (WIF) Price Prediction 2030 | $15 | $0.07 |
Conclusion
If dogwifhat (WIF) is a good investment in 2025, this year would favor the cryptocurrency. In conclusion, the bullish dogwifhat (WIF) price prediction for 2025 is $2.735. If unfavorable sentiment is triggered, the bearish dogwifhat (WIF) price prediction for 2025 is $0.305.
If the market momentum and investors’ sentiment elevate positively, dogwifhat (WIF) might hit $5. Furthermore, with future upgrades and advancements in the dogwifhat ecosystem, WIF might surpass its current all-time high (ATH) of $4.85 and mark its new ATH.
FAQ
1. What is dogwifhat (WIF)?
Dogwifhat is a meme coin on the Solana blockchain featuring a dog wearing a hat, becoming the third-largest meme coin post-launch.
2. Where can you buy dogwifhat (WIF)?
Traders can trade dogwifhat (WIF) on the following cryptocurrency exchanges such as Binance, Bybit, Bitget, and more
3. Will dogwifhat (WIF) record a new ATH soon?
With the ongoing developments and upgrades within the dogwifhat platform, dogwifhat (WIF) has a high possibility of reaching its ATH soon.
4. What is the current all-time high (ATH) of dogwifhat (WIF)?
dogwifhat (WIF) hit its current all-time high (ATH) of $4.85 on Mar 31, 2024.
5. What is the lowest price of dogwifhat (WIF)?
According to CoinMarketCap, WIF hit its all-time low (ATL) of $0.00002344 on Nov 21, 2023.
6. Will dogwifhat (WIF) hit $5?
If dogwifhat (WIF) becomes one of the active cryptocurrencies that majorly maintain a bullish trend, it might rally to hit $5 soon.
7. What will be the dogwifhat (WIF) rice by 2026?
dogwifhat (WIF) price might reach $7 by 2026.
8. What will be the dogwifhat (WIF) price by 2027?
dogwifhat (WIF) price might reach $9 by 2027.
9. What will be the dogwifhat (WIF) price by 2028?
dogwifhat (WIF) price might reach $11 by 2028.
10. What will be the dogwifhat (WIF) price by 2029?
dogwifhat (WIF) price might reach $13 by 2029.
Top Crypto Predictions
KAITO (KAITO) Price Prediction
Pi (PI) Price Prediction
Official Trump (TRUMP) Price Prediction
Disclaimer: The opinion expressed in this article is solely the author’s. It does not represent any investment advice. TheNewsCrypto team encourages all to do their own research before investing.
You May Also Like

Developers of Altcoin Traded on Binance Reveal Reason for Major Price Drop – “Legal Process Has Begun”

Gate Alpha is launching its 113th round of points airdrops. Holders of the corresponding points can be among the first to receive 0.9 or 4.5 TRUMP.
