On-chain analytics firm CryptoQuant has revealed how selling from US Bitcoin investors has dominated during the recent market downturn. Bitcoin Coinbase Premium Gap Points To US Selloff In a new thread on X, CryptoQuant has talked about some key pieces of data related to the US-dominated Bitcoin selloff. The first indicator that CryptoQuant has shared is the “Coinbase Premium Gap,” which keeps track of the difference between the BTC price listed on Coinbase (USD pair) and that on Binance (USDT pair). Related Reading: Dogecoin’s Strongest Support Zone Revealed—Here’s The Level As the below chart shows, the 30-hour moving average (MA) value of this metric has plummeted into the red territory recently. A negative value on the Coinbase Premium Gap indicates that the asset is trading at a price lower on Coinbase as compared to Binance. The former exchange is the preferred platform of the American investors, especially large institutional entities, while the latter one hosts a global traffic. As such, a red premium can be a sign that US-based whales are selling more than world investors. “The Coinbase Premium Gap dropped as low as -$90, which is a sign of strong U.S. selling pressure,” explained the analytics firm. Another metric that points toward extraordinary selling pressure from the American traders during the recent price decline is the cumulative return for the different trading sessions. From the above chart, it’s visible that both European and Asia-Pacific trading hours have seen an almost neutral return in Bitcoin over the past month. The American session, on the other hand, has witnessed a deep negative value. Another major way institutional entities invest in Bitcoin is through the spot exchange-traded funds (ETFs), investment vehicles that hold BTC on behalf of their investors, and allow them to gain off-chain exposure to the coin’s price movements. These funds have also witnessed outflows during the selloff in the last few weeks. ETFs have seen net outflows for three straight weeks now, which is a departure from last year’s Q4 trend, where 194,000 BTC flowed into the wallets connected with these funds, but in Q4 2025 so far, 8,000 BTC has flowed out instead. “ETF outflows continue to weigh on the BTC spot market,” noted CryptoQuant. Related Reading: Bitcoin Short-Term Holders Panic: 65,200 BTC Sent To Exchanges At Loss As for what could be next for Bitcoin, the cost basis of the spot ETFs may be worth watching for, which is located at $86,566. If the cryptocurrency breaches below this mark, holdings of the spot ETFs will go underwater. BTC Price At the time of writing, Bitcoin is floating around $92,000, down more than 10% over the last seven days. Featured image from Dall-E, CryptoQuant.com, chart from TradingView.comOn-chain analytics firm CryptoQuant has revealed how selling from US Bitcoin investors has dominated during the recent market downturn. Bitcoin Coinbase Premium Gap Points To US Selloff In a new thread on X, CryptoQuant has talked about some key pieces of data related to the US-dominated Bitcoin selloff. The first indicator that CryptoQuant has shared is the “Coinbase Premium Gap,” which keeps track of the difference between the BTC price listed on Coinbase (USD pair) and that on Binance (USDT pair). Related Reading: Dogecoin’s Strongest Support Zone Revealed—Here’s The Level As the below chart shows, the 30-hour moving average (MA) value of this metric has plummeted into the red territory recently. A negative value on the Coinbase Premium Gap indicates that the asset is trading at a price lower on Coinbase as compared to Binance. The former exchange is the preferred platform of the American investors, especially large institutional entities, while the latter one hosts a global traffic. As such, a red premium can be a sign that US-based whales are selling more than world investors. “The Coinbase Premium Gap dropped as low as -$90, which is a sign of strong U.S. selling pressure,” explained the analytics firm. Another metric that points toward extraordinary selling pressure from the American traders during the recent price decline is the cumulative return for the different trading sessions. From the above chart, it’s visible that both European and Asia-Pacific trading hours have seen an almost neutral return in Bitcoin over the past month. The American session, on the other hand, has witnessed a deep negative value. Another major way institutional entities invest in Bitcoin is through the spot exchange-traded funds (ETFs), investment vehicles that hold BTC on behalf of their investors, and allow them to gain off-chain exposure to the coin’s price movements. These funds have also witnessed outflows during the selloff in the last few weeks. ETFs have seen net outflows for three straight weeks now, which is a departure from last year’s Q4 trend, where 194,000 BTC flowed into the wallets connected with these funds, but in Q4 2025 so far, 8,000 BTC has flowed out instead. “ETF outflows continue to weigh on the BTC spot market,” noted CryptoQuant. Related Reading: Bitcoin Short-Term Holders Panic: 65,200 BTC Sent To Exchanges At Loss As for what could be next for Bitcoin, the cost basis of the spot ETFs may be worth watching for, which is located at $86,566. If the cryptocurrency breaches below this mark, holdings of the spot ETFs will go underwater. BTC Price At the time of writing, Bitcoin is floating around $92,000, down more than 10% over the last seven days. Featured image from Dall-E, CryptoQuant.com, chart from TradingView.com

Bitcoin Crash Dominated By US Selling, CryptoQuant Data Shows

2025/11/21 14:00

On-chain analytics firm CryptoQuant has revealed how selling from US Bitcoin investors has dominated during the recent market downturn.

Bitcoin Coinbase Premium Gap Points To US Selloff

In a new thread on X, CryptoQuant has talked about some key pieces of data related to the US-dominated Bitcoin selloff. The first indicator that CryptoQuant has shared is the “Coinbase Premium Gap,” which keeps track of the difference between the BTC price listed on Coinbase (USD pair) and that on Binance (USDT pair).

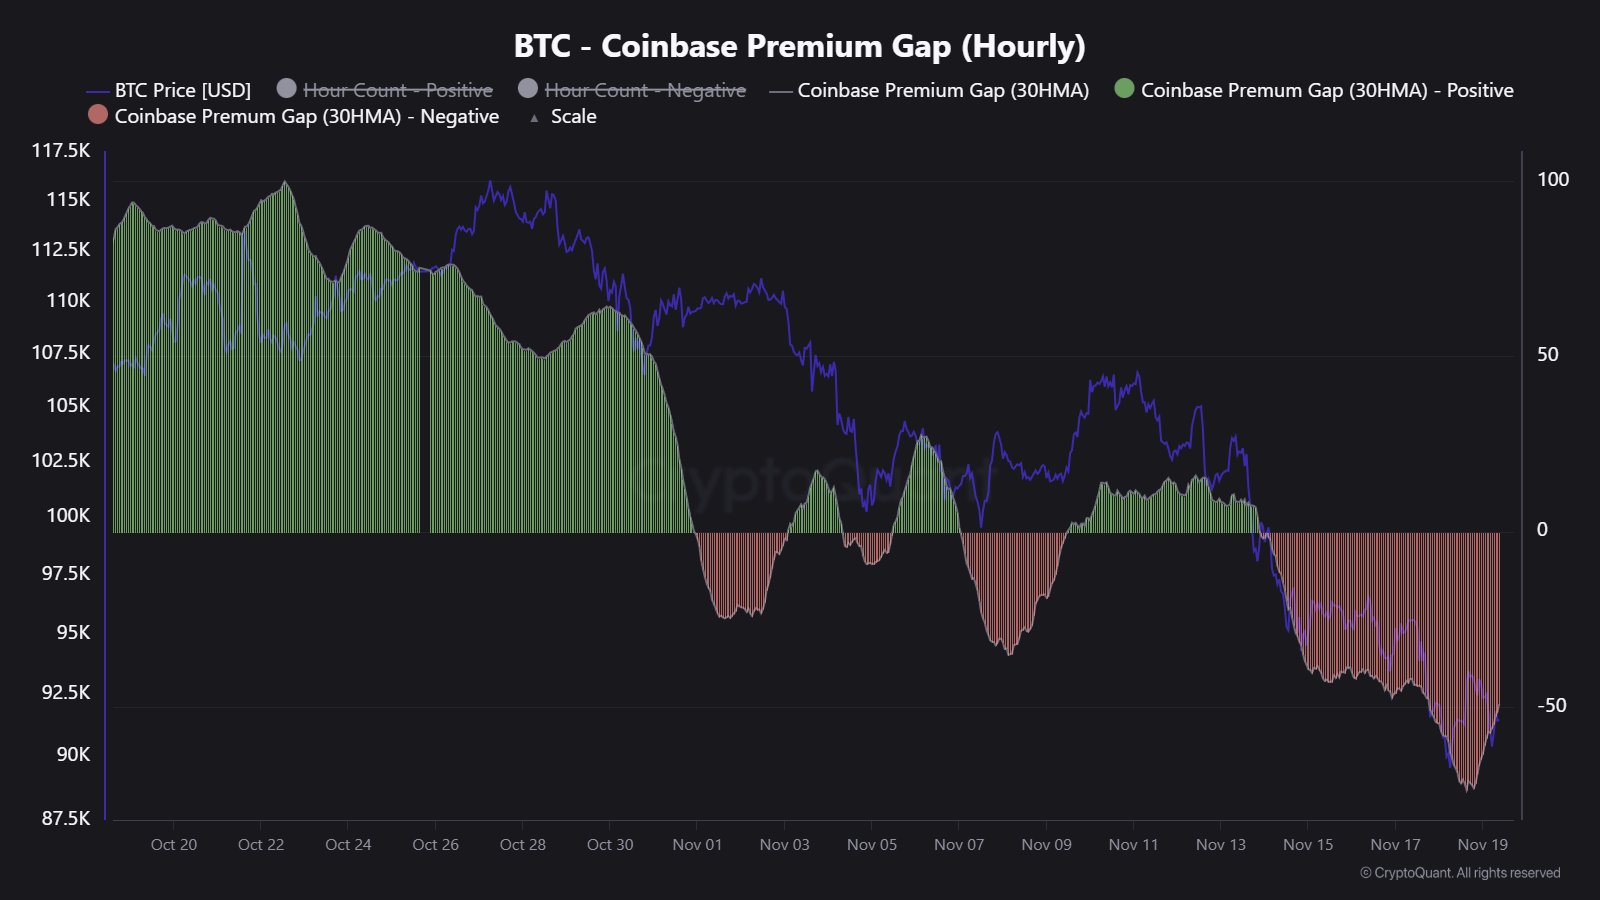
As the below chart shows, the 30-hour moving average (MA) value of this metric has plummeted into the red territory recently.
Bitcoin Coinbase Premium Gap

A negative value on the Coinbase Premium Gap indicates that the asset is trading at a price lower on Coinbase as compared to Binance. The former exchange is the preferred platform of the American investors, especially large institutional entities, while the latter one hosts a global traffic. As such, a red premium can be a sign that US-based whales are selling more than world investors.

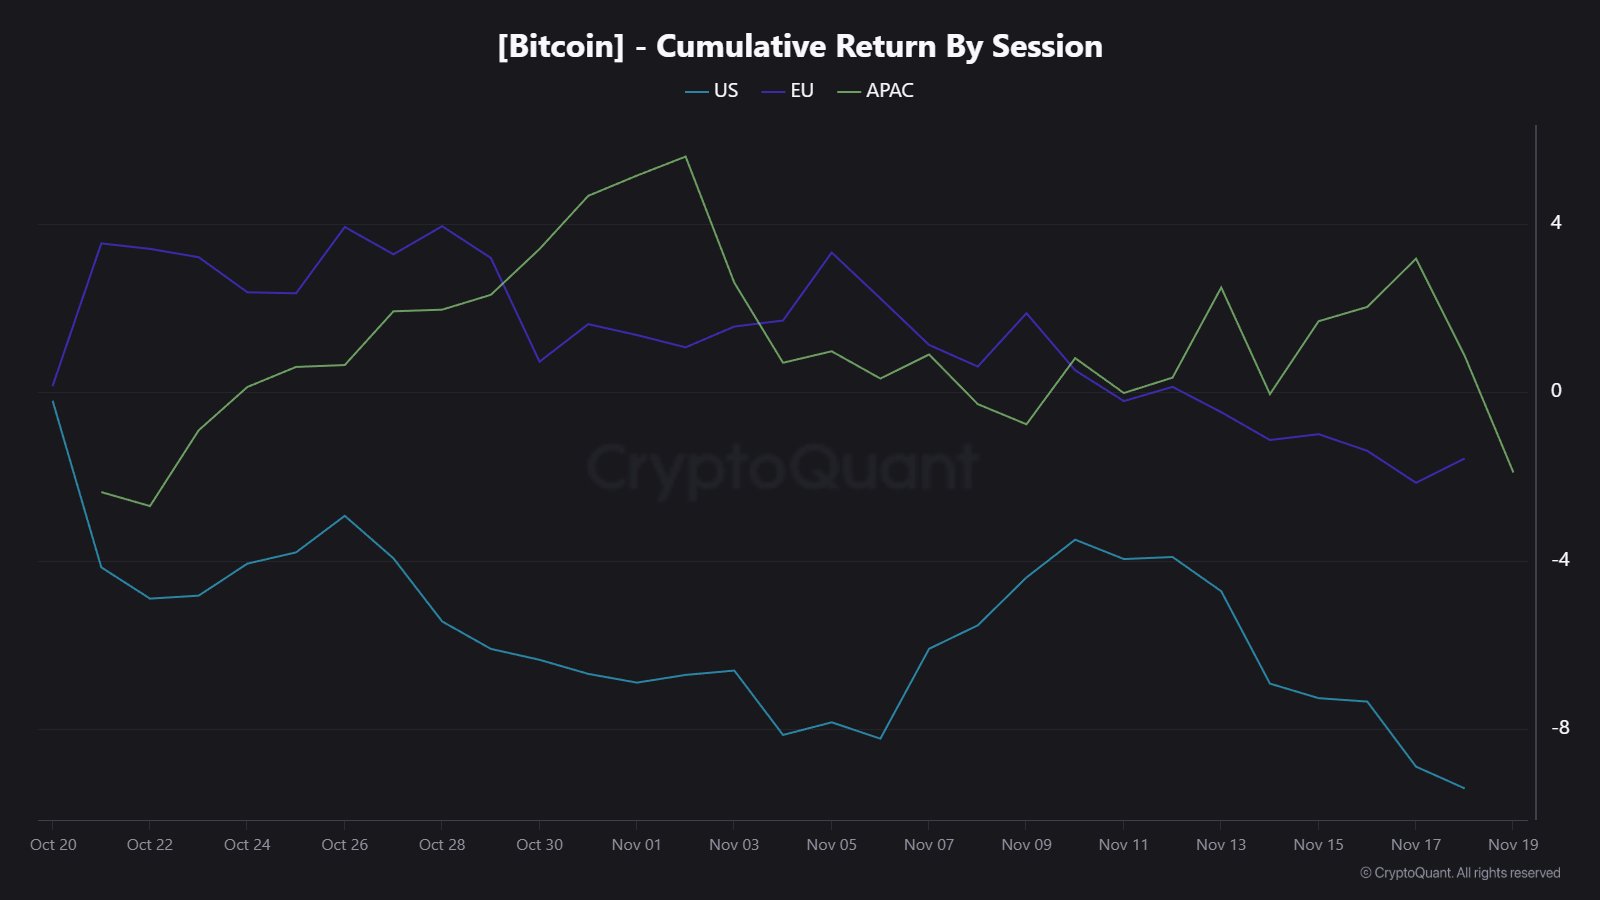
“The Coinbase Premium Gap dropped as low as -$90, which is a sign of strong U.S. selling pressure,” explained the analytics firm. Another metric that points toward extraordinary selling pressure from the American traders during the recent price decline is the cumulative return for the different trading sessions.
Bitcoin Cumulative Return

From the above chart, it’s visible that both European and Asia-Pacific trading hours have seen an almost neutral return in Bitcoin over the past month. The American session, on the other hand, has witnessed a deep negative value.

Another major way institutional entities invest in Bitcoin is through the spot exchange-traded funds (ETFs), investment vehicles that hold BTC on behalf of their investors, and allow them to gain off-chain exposure to the coin’s price movements.

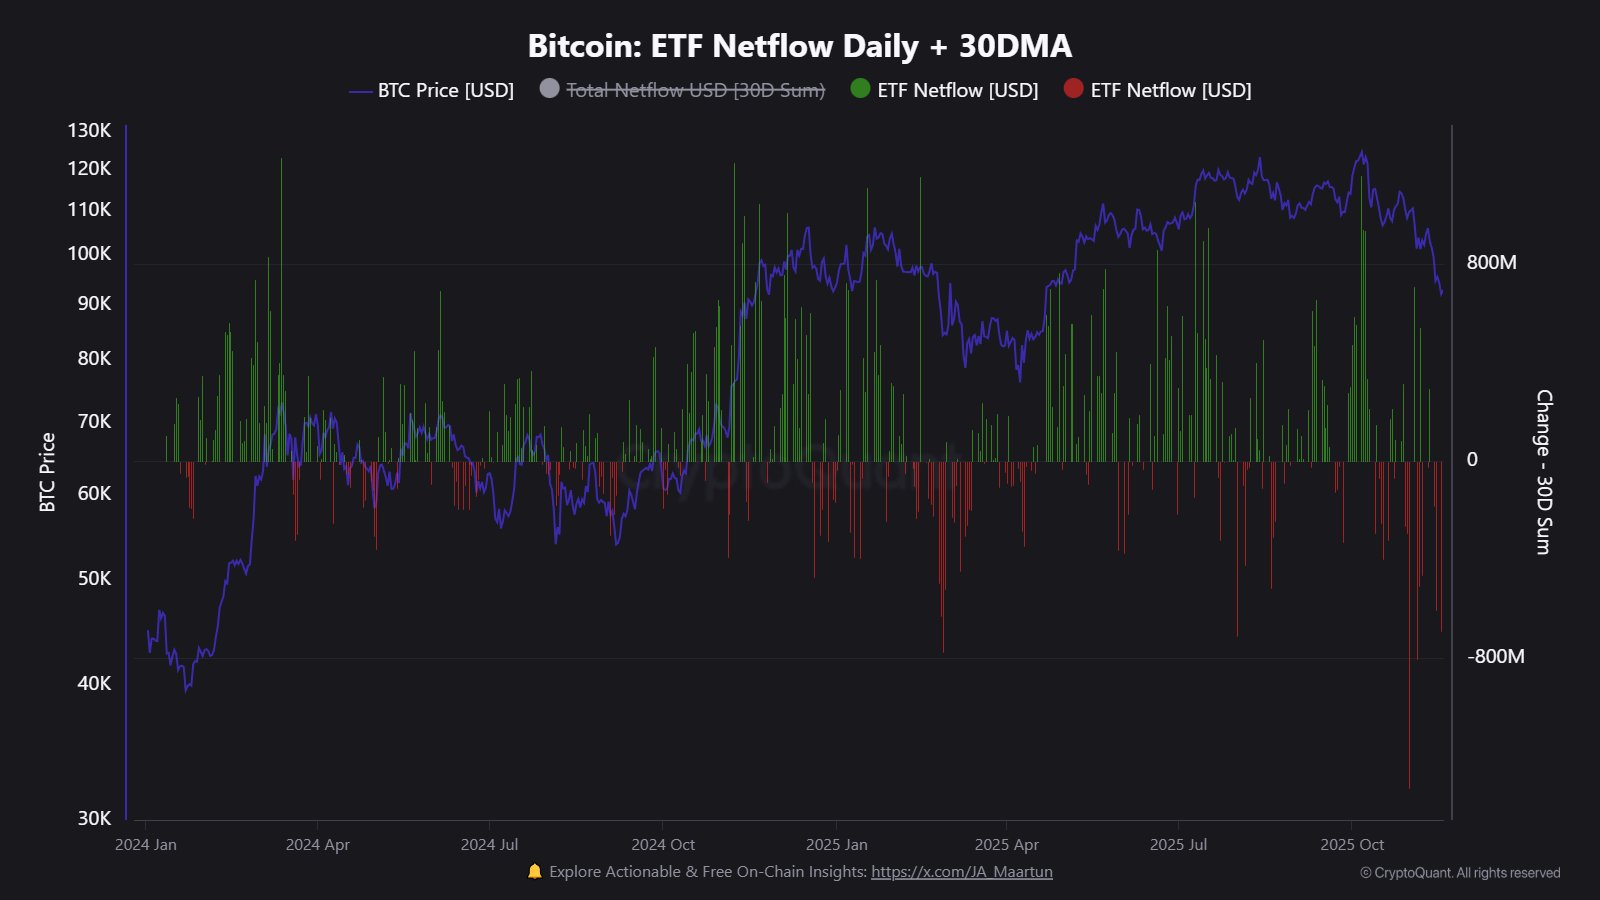
These funds have also witnessed outflows during the selloff in the last few weeks.
Bitcoin ETF Netflow

ETFs have seen net outflows for three straight weeks now, which is a departure from last year’s Q4 trend, where 194,000 BTC flowed into the wallets connected with these funds, but in Q4 2025 so far, 8,000 BTC has flowed out instead. “ETF outflows continue to weigh on the BTC spot market,” noted CryptoQuant.

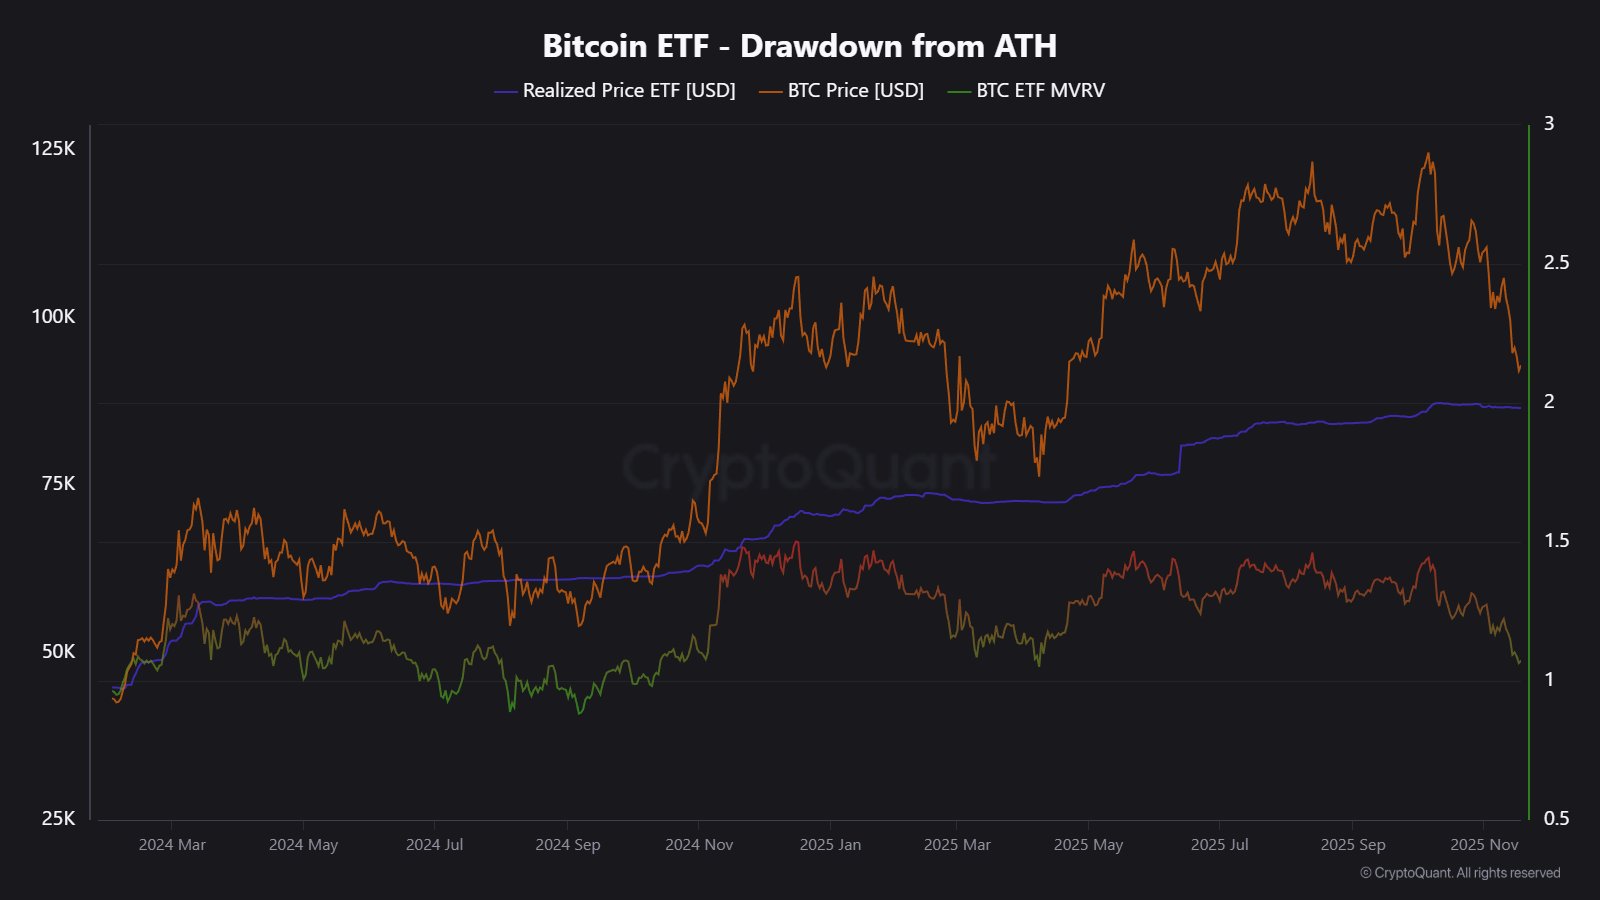
As for what could be next for Bitcoin, the cost basis of the spot ETFs may be worth watching for, which is located at $86,566. If the cryptocurrency breaches below this mark, holdings of the spot ETFs will go underwater.
Bitcoin ETF Realized Price

BTC Price

At the time of writing, Bitcoin is floating around $92,000, down more than 10% over the last seven days.

Bitcoin Price Chart
Disclaimer: The articles reposted on this site are sourced from public platforms and are provided for informational purposes only. They do not necessarily reflect the views of MEXC. All rights remain with the original authors. If you believe any content infringes on third-party rights, please contact service@support.mexc.com for removal. MEXC makes no guarantees regarding the accuracy, completeness, or timeliness of the content and is not responsible for any actions taken based on the information provided. The content does not constitute financial, legal, or other professional advice, nor should it be considered a recommendation or endorsement by MEXC.

You May Also Like

Tether Uruguayan Mining Operations Stalls Due To $5 Million Energy Debt — Details

Tether Uruguayan Mining Operations Stalls Due To $5 Million Energy Debt — Details

The post Tether Uruguayan Mining Operations Stalls Due To $5 Million Energy Debt — Details appeared on BitcoinEthereumNews.com. Tether Uruguayan Mining Operations Stalls Due To $5 Million Energy Debt — Details Sign Up for Our Newsletter! For updates and exclusive offers enter your email. Semilore Faleti works as a crypto-journalist at Bitconist, providing the latest updates on blockchain developments, crypto regulations, and the DeFi ecosystem. He is a strong crypto enthusiast passionate about covering the growing footprint of blockchain technology in the financial world. This website uses cookies. By continuing to use this website you are giving consent to cookies being used. Visit our Privacy Center or Cookie Policy. I Agree Source: https://bitcoinist.com/tether-uruguayan-mining-operations-5-million-debt/
Share
BitcoinEthereumNews2025/09/21 10:02