

XRP price outlook: is bearish pressure near exhaustion?
 The XRP price has slipped into a technically fragile area, and traders are trying to understand whether this is the start of a deeper slide or the last shakeout before a rebound. In the following sections, we will connect market sentiment, trend indicators and key price zones to outline where the asset stands now and how it might evolve next.
 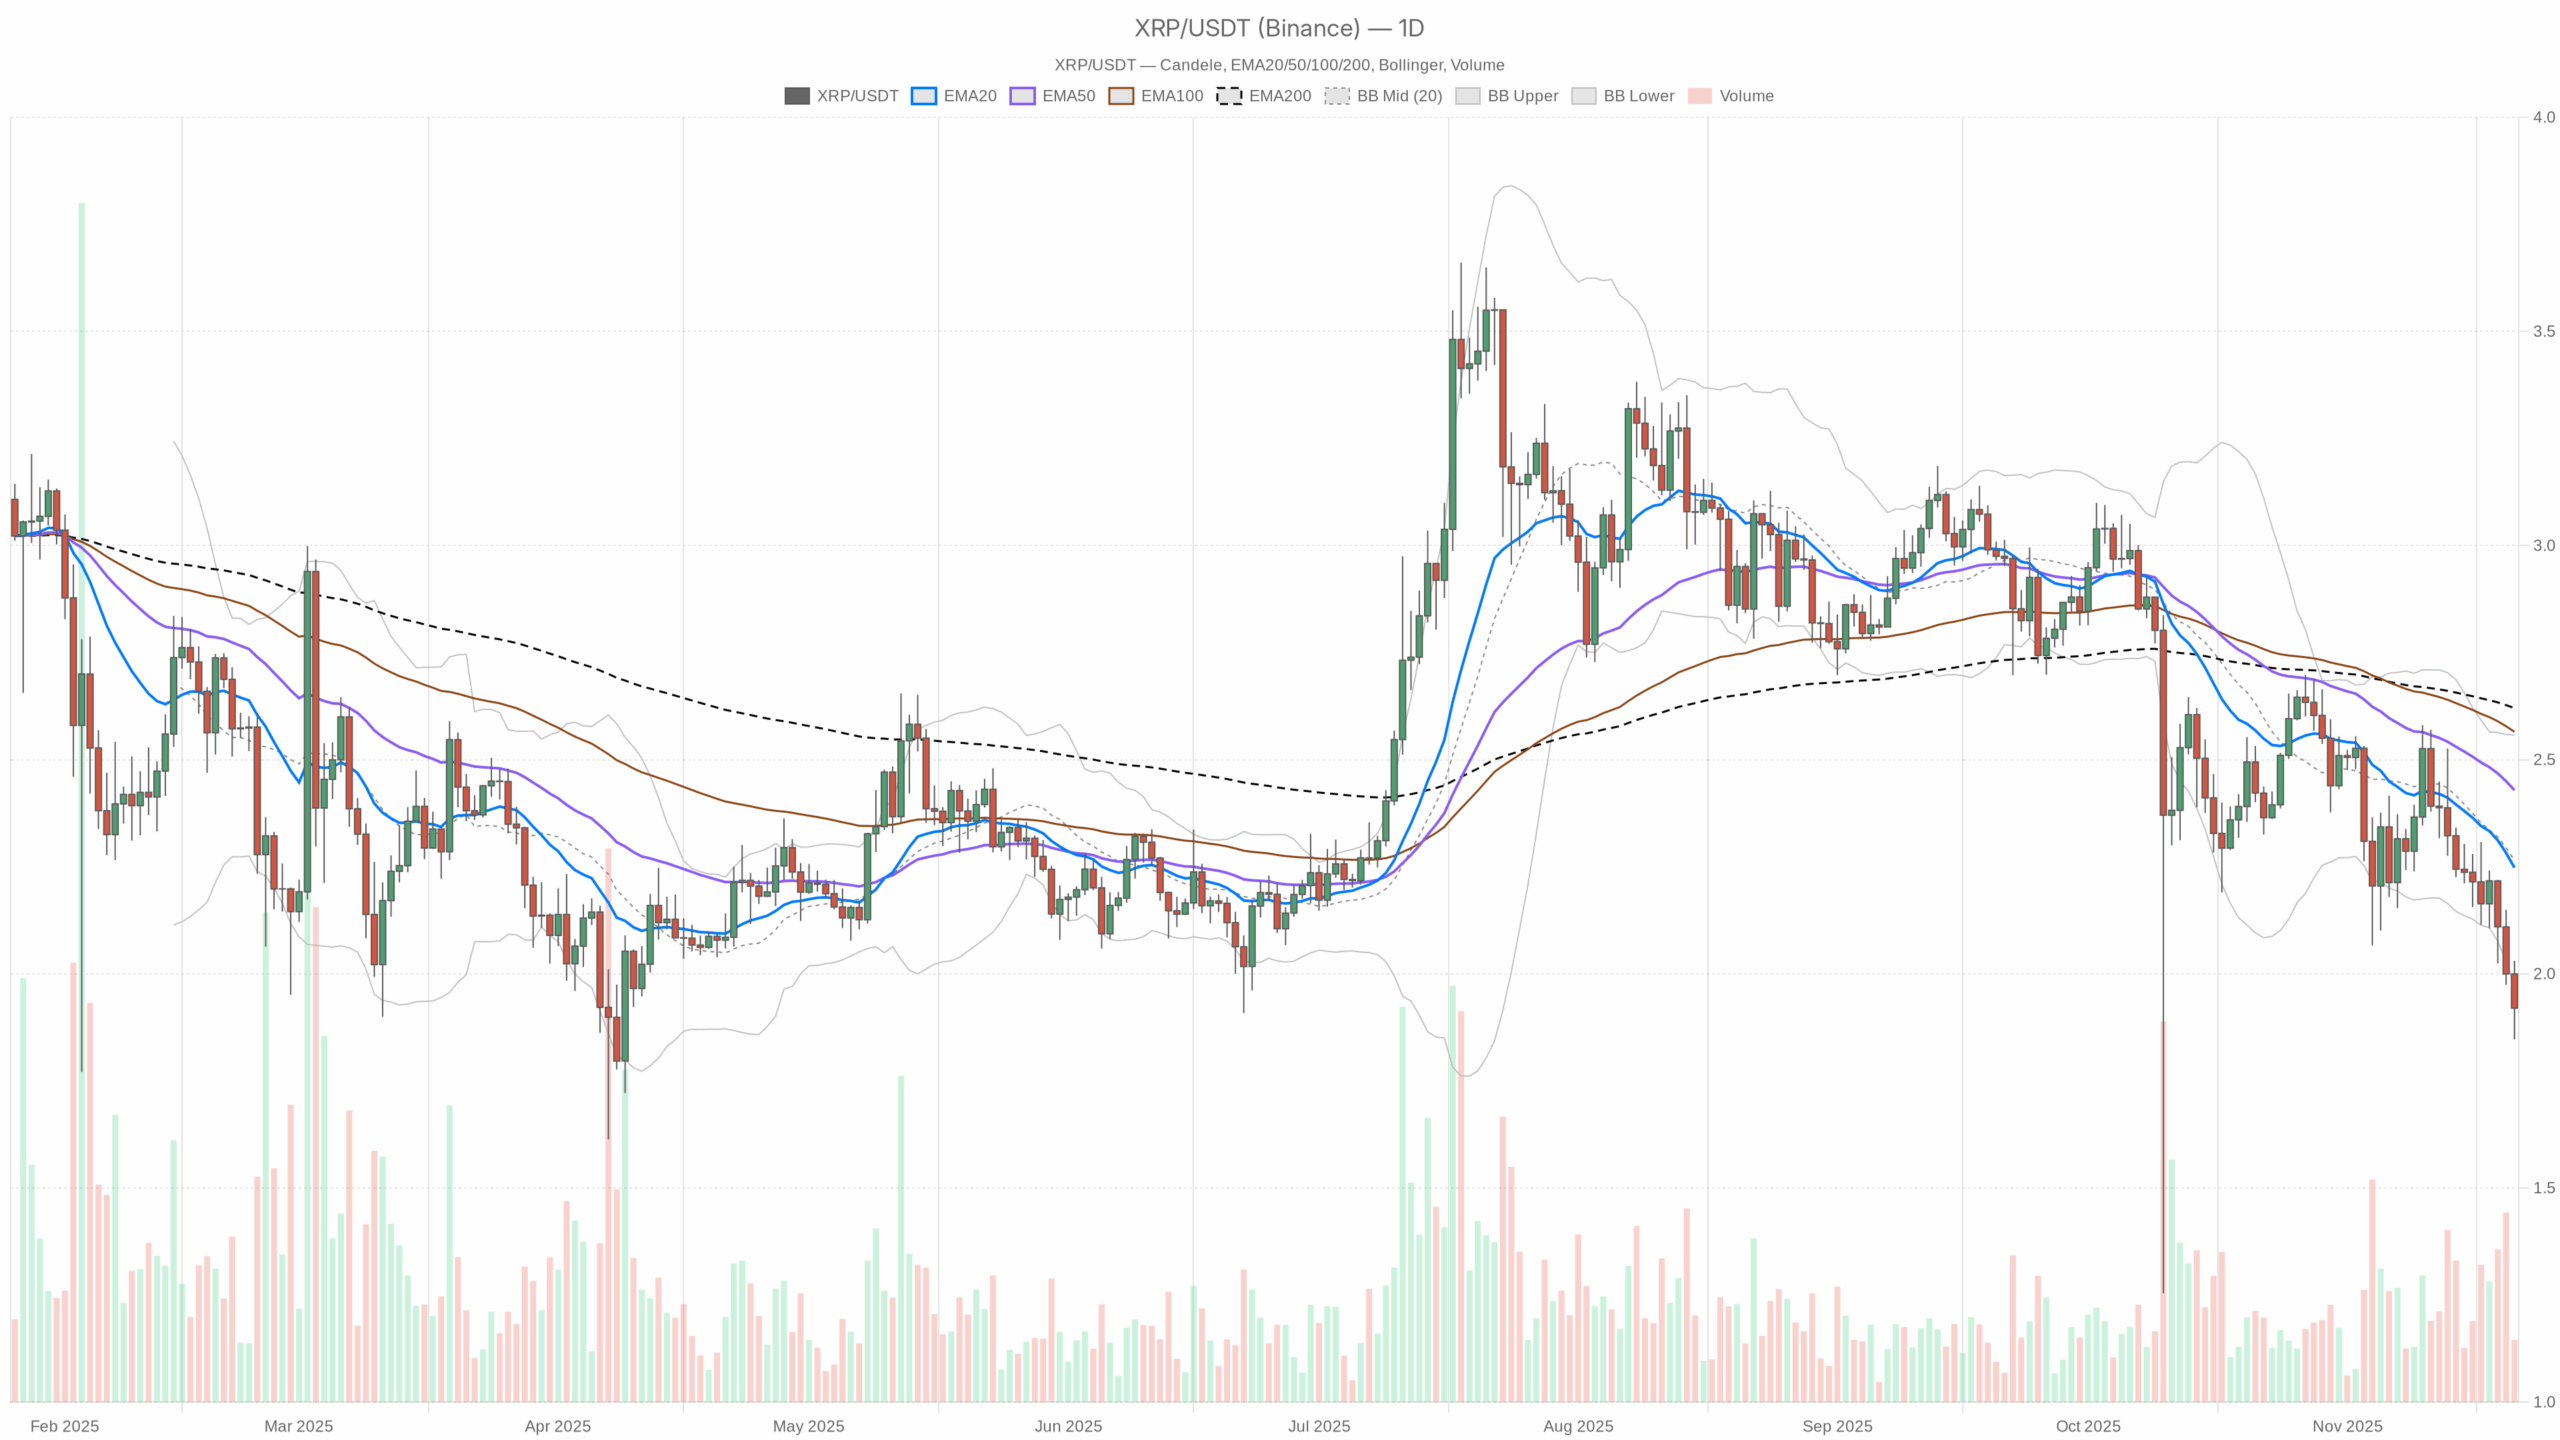 XRP/USDT — daily chart with candlesticks, EMA20/EMA50 and volume.
Summary
The token is trading around 1.92, clearly below its main daily moving averages, pointing to a dominant bearish regime. Daily and intraday RSI readings are near or below 30, signaling strong downside momentum but also emerging oversold conditions. MACD lines remain negative across timeframes, which confirms that bears still control the medium-term direction. Moreover, price is trading close to the lower Bollinger Bands, indicating compressed downside extremes after recent selling. Volatility, captured by ATR, is moderate on the daily chart and relatively contained intraday, suggesting controlled but persistent pressure rather than panic. Meanwhile, global crypto capitalization has dropped sharply and sentiment is in Extreme Fear, reinforcing the risk-off backdrop for this asset.
XRP price usd: Market Context and Direction
The broader market is under stress, with total crypto capitalization near 2.97 trillion dollars and a steep 24-hour drawdown of about 8%. Bitcoin dominance stands around 56.6%, showing that capital is clustering in the largest asset as investors de-risk from altcoins. That said, this defensive positioning often amplifies weakness in secondary names, which fits the current setup of this token.
The Fear & Greed Index sits at 14, firmly in the Extreme Fear zone. In such an environment, liquidity tends to thin out on the bid side, and bounces can be shallow or short-lived until confidence returns. However, Extreme Fear can also precede medium-term bottoms when sellers become exhausted. For now, the alignment of a bearish daily regime and risk-off sentiment suggests that the primary scenario remains to the downside, with room for tactical rebounds rather than a sustained uptrend.
Technical Outlook: reading the overall setup
On the daily chart, the asset trades at 1.92, below the 20-day EMA at 2.25, the 50-day EMA at 2.43 and the 200-day EMA at 2.62. This triple alignment of price under all key EMAs characterizes a mature downtrend structure, where rallies are more likely to be sold than followed.
The daily RSI at 30.74 is hovering at the edge of oversold territory. This reading reflects downside momentum close to exhaustion, but not yet reversed. It implies that additional, sharp selling could quickly turn conditions deeply oversold, opening the door to a reflex bounce. Yet, without a clear RSI rebound above the mid-40s, the bigger picture remains fragile.
MACD on the daily timeframe shows the line at -0.12 and the signal at -0.09, with a slightly negative histogram of -0.03. This configuration supports a bearish but slowly decelerating momentum phase. Sellers are still in charge, but the gap between MACD and its signal is not widening aggressively, hinting that the worst of the impulse might be behind us if no new shock appears.
Bollinger Bands add further context: the mid-band is at 2.27 with the lower band at 1.97, and the price is hovering just under this lower edge. Trading so close to the band’s bottom suggests downside extension beyond the recent mean, which often precedes consolidation or a mean-reverting move. Still, during strong trends, price can “walk the band” lower, so traders should wait for a decisive push back above the mid-band to argue for a trend reversal.
The daily ATR stands near 0.16, showing a moderate level of daily volatility. This points to a market where directional moves are persistent but not chaotic; the downtrend is grinding rather than capitulating. Combined, these indicators favor a base case of ongoing weakness with increasing chances of a technical bounce if oversold readings deepen.
Intraday Perspective and XRPUSDT token Momentum
Intraday charts largely echo the daily picture, underscoring how tightly short-term action is aligned with the broader downtrend. On the hourly timeframe, price sits around 1.92 while the 20, 50 and 200-period EMAs cluster above it at 2.01, 2.07 and 2.19. This configuration highlights a layered resistance stack overhead, where each rebound attempt faces nearby supply.
Meanwhile, hourly RSI at 27.28 is clearly oversold, reflecting acute intraday selling pressure. MACD on this timeframe is also negative, though its histogram is only slightly below zero, pointing to fading intraday momentum rather than an acceleration lower. As a result, short-term traders may look for tactical bounces, but the burden of proof remains on buyers to reclaim intraday EMAs.
On the 15-minute chart, the pattern is similar: price around 1.92 sits beneath the 20, 50 and 200-period EMAs at 1.97, 2.00 and 2.07. The RSI here is even more stretched at 23.88, which increases the probability of quick, corrective pops. However, as long as these lower timeframes remain in a declared bearish regime, countertrend rallies are more likely to be selling opportunities than the start of a new up-leg.
Key Levels and Market Reactions
Daily pivot levels offer a helpful map for near-term behavior. The central pivot point sits at 1.93, almost exactly where the token is trading, marking an important battleground between bulls and bears. A sustained move below this zone would keep the focus on support near 1.83, the first downside reference. If price slices through 1.83 on strong volume, it would confirm a continuation of the prevailing bearish leg and could invite further downside.
On the upside, the first resistance cluster emerges around 2.02 on the daily pivot and near the lower to mid Bollinger region. A recovery above this area, especially if it drags price back above the 20-day EMA at 2.25, would signal early signs of short-covering and potential trend repair. Until that happens, rallies into the 2.00–2.25 band should be treated as vulnerable.
Intraday, the hourly pivot at 1.91, with resistance around 1.98 and support at 1.85, refines this picture. Short-term traders will likely watch how the asset reacts between 1.85 and 1.98: repeated failures near the upper boundary would reinforce the bearish bias, whereas a firm breakout above could fuel a fast move toward the daily resistance zones.
Future Scenarios and Investment Outlook
Overall, the XRP price sits in a clearly bearish setup, but with indicators hinting that selling momentum is not far from exhaustion. If global risk sentiment stabilizes and Extreme Fear begins to fade, oversold technicals could trigger a relief rally toward the 2.00–2.25 region. In that case, active traders might lean on a strategy of buying dips within a short-term recovery channel, while remaining alert to resistance near the main EMAs.
In a more negative scenario, continued macro or market stress could push the token firmly below 1.83, reopening room for an extended downtrend. Longer-term investors may prefer to wait for clear trend confirmation through reclaimed moving averages and an RSI recovery before increasing exposure. For now, patience and disciplined risk management remain crucial in navigating this late-stage downswing.
This analysis is for informational purposes only and does not constitute financial advice.
Readers should conduct their own research before making investment decisions.
You May Also Like

Trump expected to sign executive order for TikTok U.S. deal on Thursday
Bitfarms Ltd. (BITF) Stock Rises as AI Data Center Plans Accelerate with $50M Drawdown
