

Anti-CZ Whale Loses Big: $61M in Profit Wiped Out As Ethereum and XRP Longs Collapse
Ethereum has officially broken below key support levels, and market sentiment is rapidly deteriorating as major assets across the crypto landscape continue to slide. Analysts are increasingly calling for the arrival of a new bear market, noting that both Bitcoin and the leading altcoins have lost critical technical zones that previously held the broader structure together. ETH, now trading at multi-month lows, is feeling the full weight of cascading liquidations, strong sell-side volume, and evaporating investor confidence.
Adding to the growing uncertainty, Lookonchain reports a striking development: in just 10 days, more than $61 million in profit has disappeared for a well-known market participant often referred to as the Anti-CZ Whale.
This trader previously gained attention for aggressively opening shorts immediately after CZ purchased ASTER — a move that paid off handsomely until the recent violent downturn reversed his fortunes.
The Anti-CZ Whale’s Unrealized Profit Collapse Adds Pressure
According to Lookonchain, the trader known as the Anti-CZ Whale has taken a massive hit during the latest market downturn — and Ethereum sits at the center of the damage. Just 10 days ago, this whale had accumulated nearly $100 million in total profit on Hyperliquid, largely fueled by aggressive positions built during periods of high volatility.
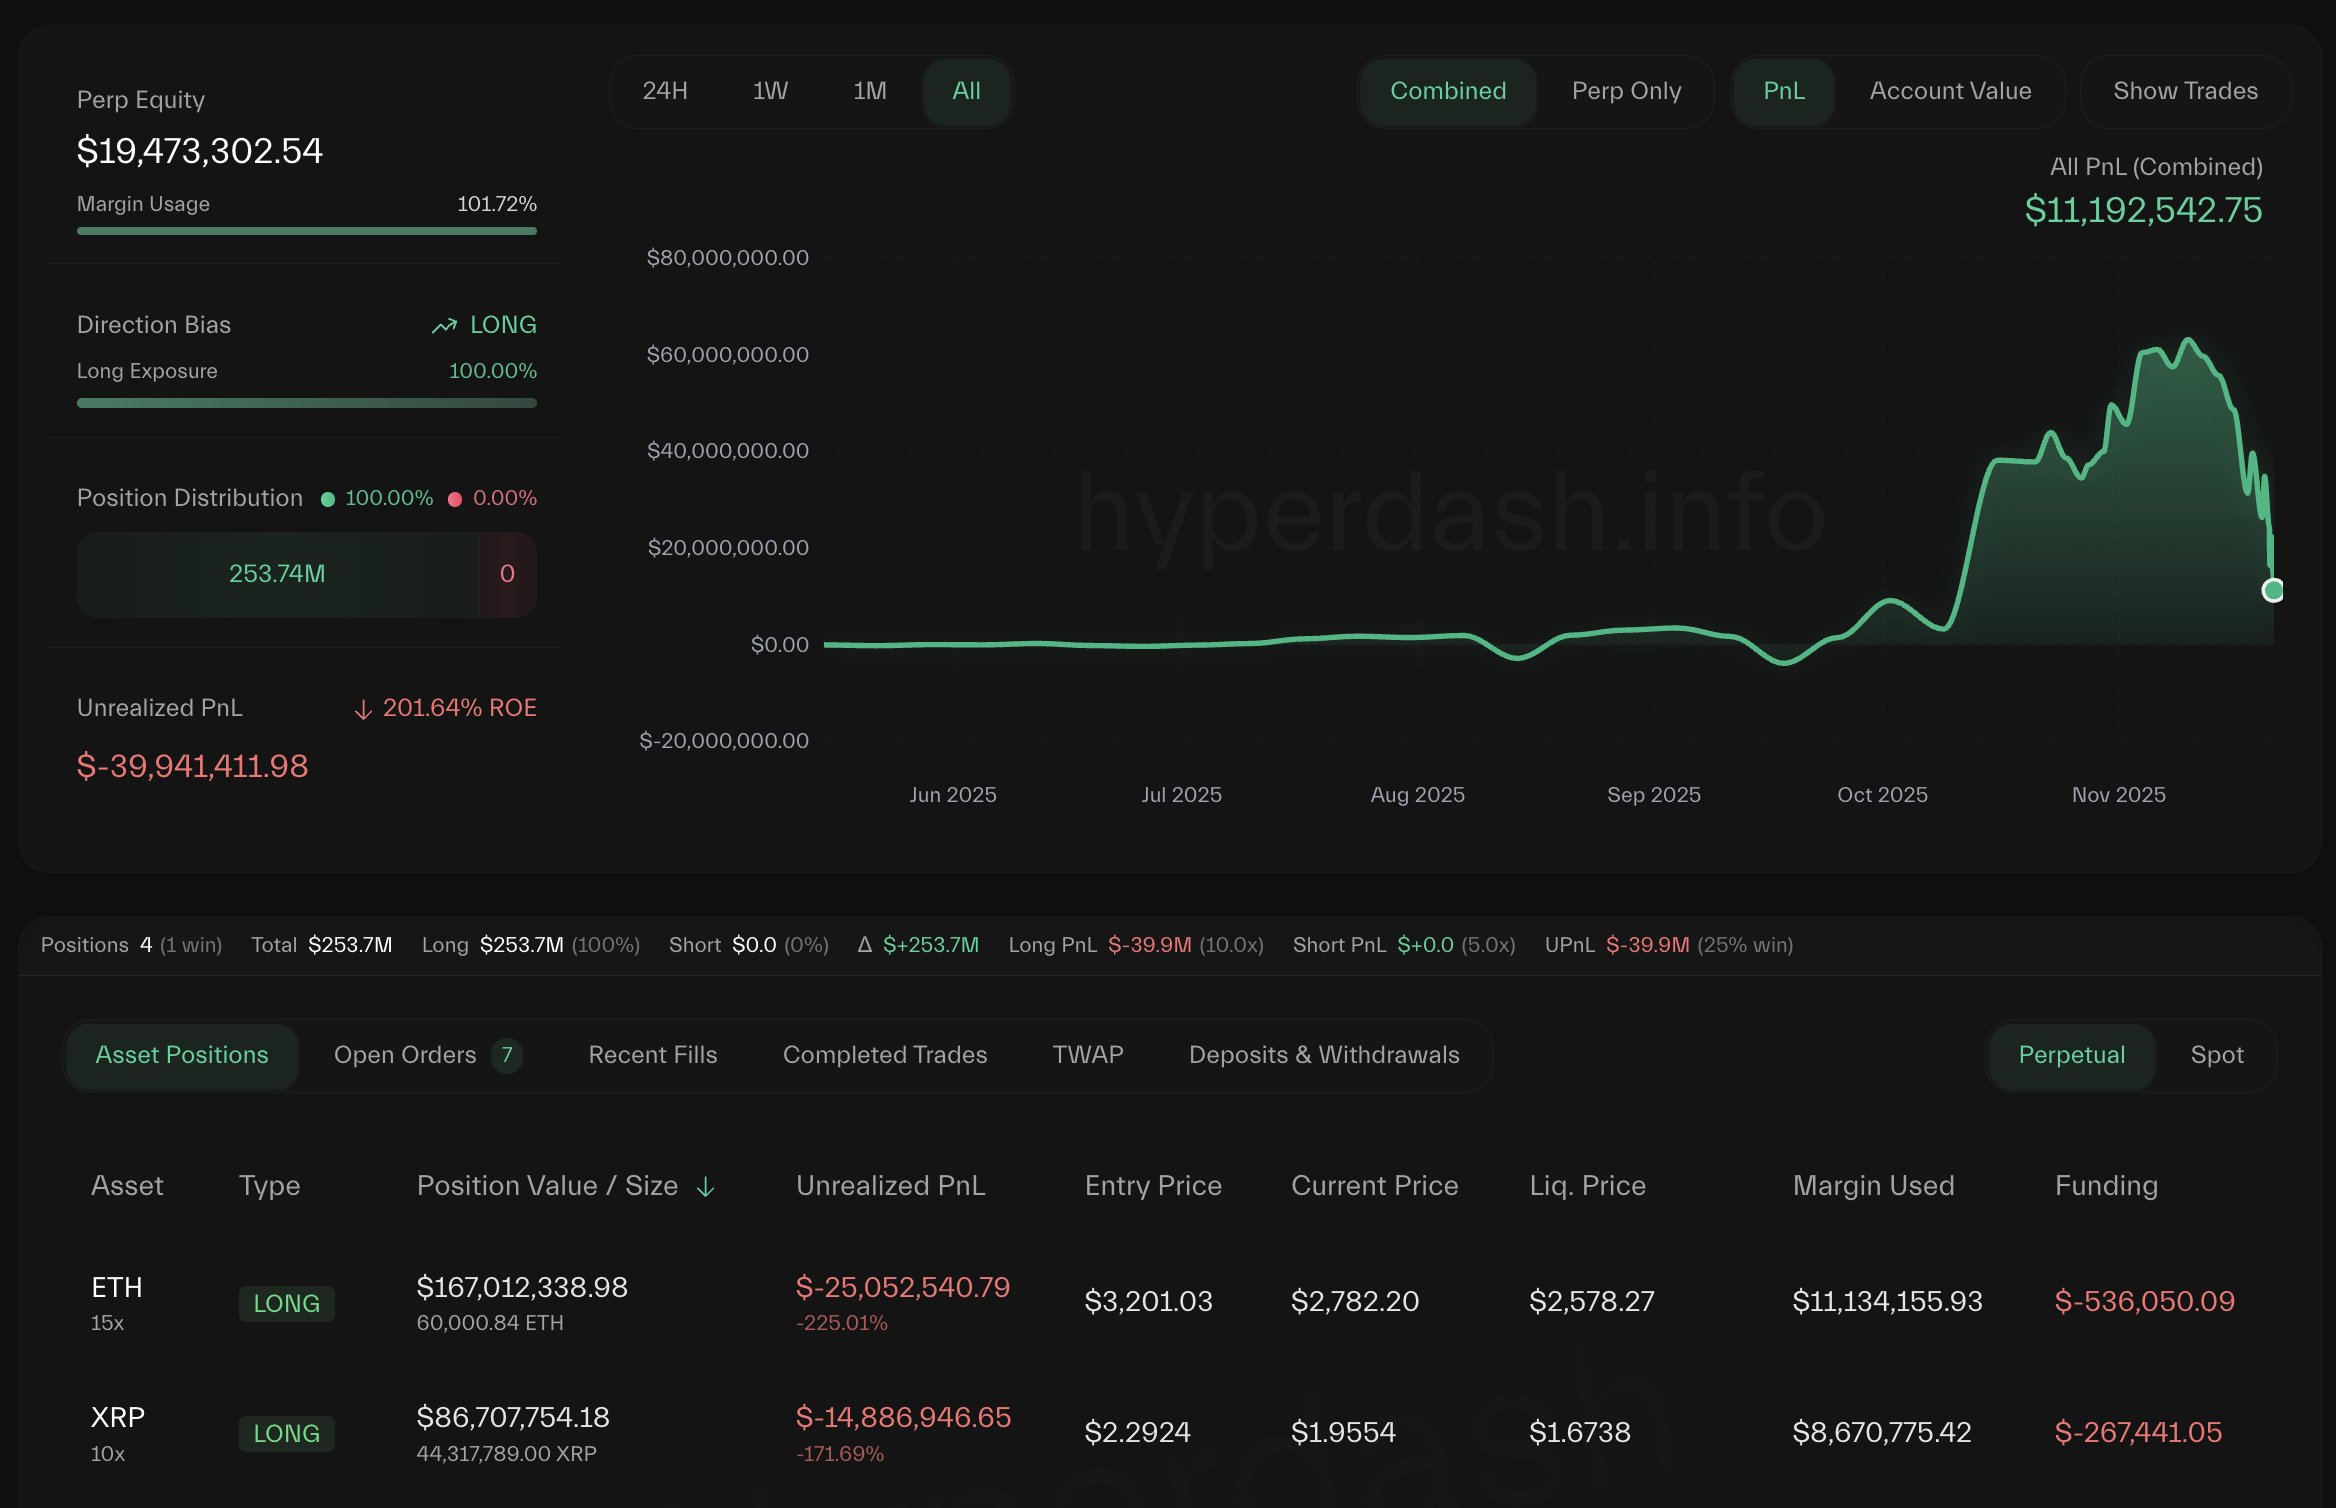
However, as the crypto market sharply corrected, his oversized ETH and XRP longs turned against him. The result has been a brutal drawdown: his total profit has now fallen to just $38.4 million, wiping out more than 60% of gains in less than two weeks.
This dramatic reversal reflects more than one trader’s misfortune — it signals the extent of the pressure weighing on Ethereum. As ETH continues to decline and investor sentiment deteriorates, even the most seasoned actors are struggling to navigate the volatility. The whale’s rapid profit erosion highlights how quickly bullish conviction can shift when key support levels fail.
For Ethereum, holding the current zone is crucial. Price action has already inflicted significant pain across longs, short-term holders, and leveraged players. If ETH loses this support decisively, the next wave of forced selling could deepen losses and accelerate the broader market capitulation.
ETH Price Analysis: Testing a Major Weekly Support Zone
Ethereum has entered a critical phase on the weekly timeframe, with price pulling back sharply toward the $2,680 region — a level that now acts as the last meaningful support before a deeper market breakdown. The chart shows a strong rejection from the $4,500 zone earlier this quarter, followed by a sustained series of lower highs and lower lows, confirming a medium-term downtrend.
The 50-week moving average has been lost decisively, and ETH is now sitting directly on top of the 100-week MA, a level that has historically acted as a key pivot during major market corrections.

Volume has expanded during the recent drop, highlighting an environment driven by fear and forced selling rather than controlled profit-taking. This aligns with broader market conditions, where liquidity is thin and volatility remains elevated across majors. A clean break below $2,650 would open the door for a retest of the $2,300–$2,400 zone, which served as strong accumulation during previous cycles.
However, the weekly chart also shows that ETH is entering a historically oversold area, similar to mid-2022 and late-2023, where reversals eventually formed after weeks of compression. For now, Ethereum must hold above this weekly support to avoid a deeper retrace and preserve the structure needed for a potential recovery.
Featured image from ChatGPT, chart from TradingView.com
You May Also Like

Expert Outlines $79,300 as Key Level To Watch For Bitcoin ETF Buyers: Here’s Why

Ethereum Falls 10% in Sudden Sell-Off, Is a Bigger Breakdown Coming?
