TLDR Solana price recovered above $120 and is currently trading near $126, but faces resistance at the $127-$128 zone The cryptocurrency needs to break above $130TLDR Solana price recovered above $120 and is currently trading near $126, but faces resistance at the $127-$128 zone The cryptocurrency needs to break above $130

Solana (SOL) Price: Rebounds as Chaikin Money Flow Shows Easing Selling Pressure

TLDR

  • Solana price recovered above $120 and is currently trading near $126, but faces resistance at the $127-$128 zone
  • The cryptocurrency needs to break above $130 to shift short-term momentum, with major resistance levels at $135 and $144
  • Chaikin Money Flow indicator shows capital outflows are slowing, suggesting selling pressure is easing
  • New Solana addresses dropped 11.3% from 6.077 million to 5.390 million over ten days, showing weaker network participation
  • Recovery depends on existing holders maintaining support rather than new investor inflows

Solana has started a recovery wave after dropping to $117 earlier this week. The cryptocurrency climbed above the $120 mark and is currently trading near $126.

Solana (SOL) PriceSolana (SOL) Price

The price moved above key technical levels including the $122 and $124 zones. SOL also surpassed the 100-hourly simple moving average during the recovery.

However, bulls are facing resistance around the $127-$128 area. A bearish trend line on the hourly chart shows resistance forming at $127.

The recovery came after SOL bounced from the $117 support level. The move cleared the 50% Fibonacci retracement level of the recent downward move from $134 to $117.

Bulls pushed the price above $125 but met resistance near $127. The 61.8% Fibonacci retracement level sits at this resistance zone.

Key Resistance Levels Ahead

The next major resistance stands at $130. This level represents a critical threshold for changing short-term momentum.

If Solana clears $130, the main resistance target would be $135. A successful close above $135 could open the path toward $144.

Further gains beyond $144 might send the price toward the $150 level. However, each resistance level will require sustained buying pressure to overcome.

On the downside, initial support sits near $125. The first major support level is located at $122.

A break below $122 could push Solana toward the $117 support zone. Falling below $117 might expose the $108 level as the next downside target.

On-Chain Metrics Show Mixed Signals

The Chaikin Money Flow indicator has posted an uptick over recent days. While the indicator remains below the zero line, the upward movement suggests capital outflows are slowing.
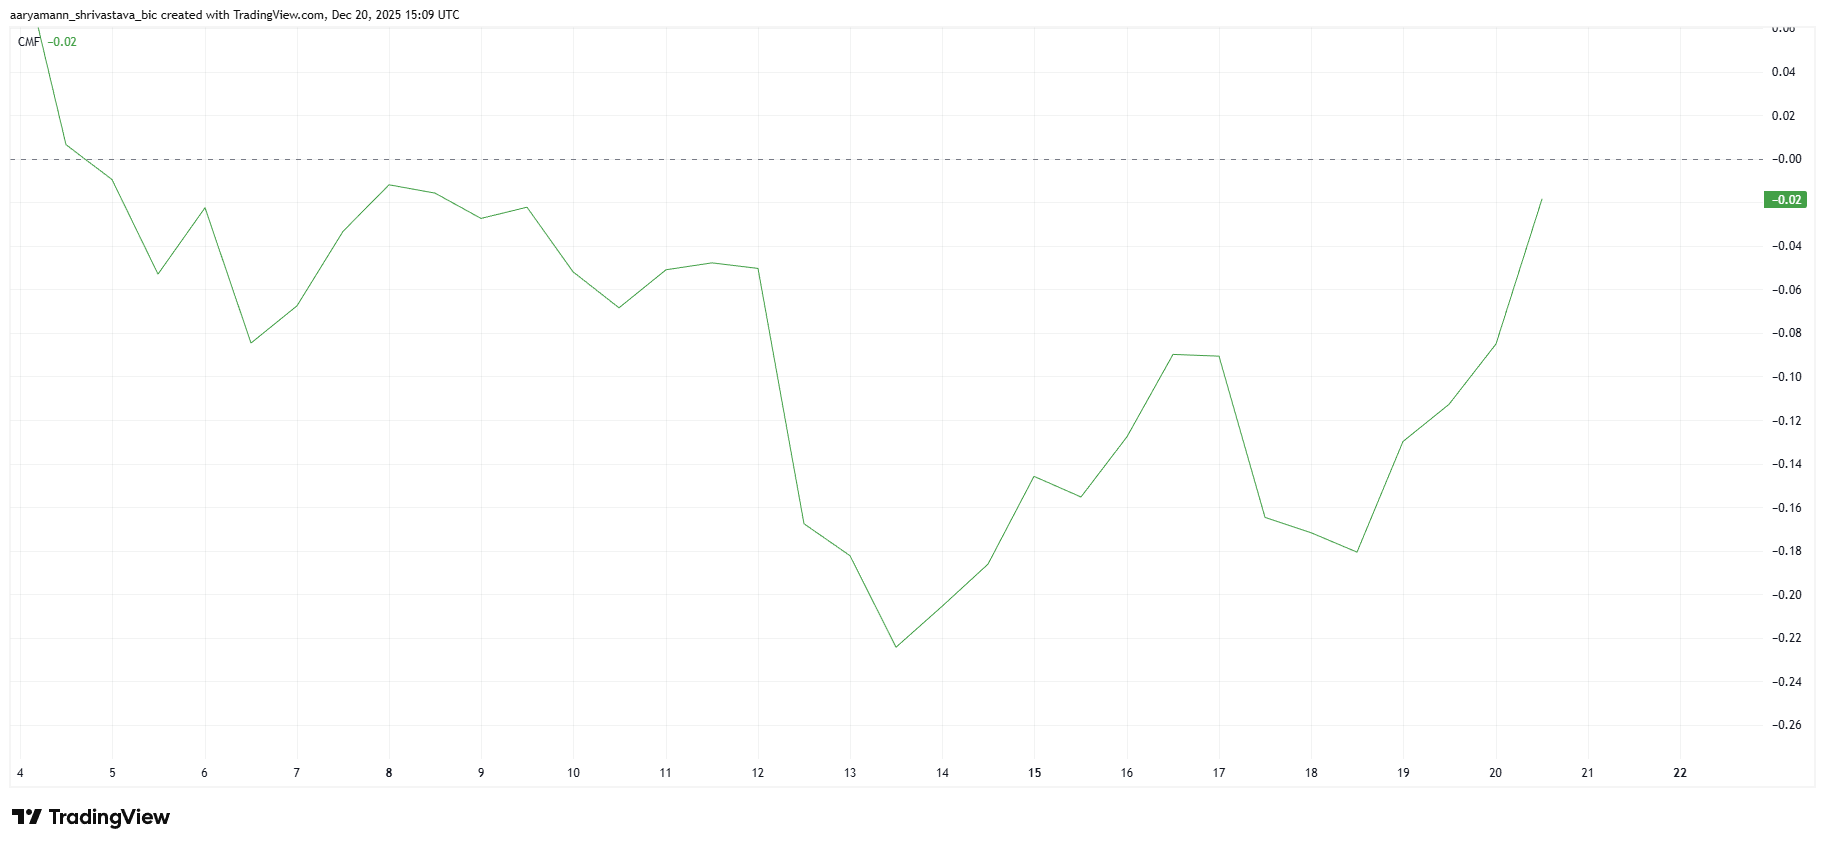
Solana CMFSource: TradingView

This change in flow patterns often precedes a shift toward inflows. When buying pressure exceeds selling activity, prices typically respond quickly.

However, network growth data presents a more cautious picture. New Solana addresses have declined sharply in recent sessions.

The number of new addresses dropped from 6.077 million to 5.390 million over ten days. This represents an 11.3% decrease in network participation.

The decline in new addresses suggests weaker interest from fresh investors. New market participants appear hesitant to enter at current price levels.

This lack of new demand means existing Solana holders carry more weight in supporting price stability. Current holders must maintain their positions or add to them for recovery to continue.

The recovery attempt shows SOL trading in a consolidation pattern rather than a clear breakout. Price action remains capped below the $130 resistance level at the time of writing.

The post Solana (SOL) Price: Rebounds as Chaikin Money Flow Shows Easing Selling Pressure appeared first on CoinCentral.

Market Opportunity
Solana Logo
Solana Price(SOL)
$127,78
$127,78$127,78
-0,21%
USD
Solana (SOL) Live Price Chart
Disclaimer: The articles reposted on this site are sourced from public platforms and are provided for informational purposes only. They do not necessarily reflect the views of MEXC. All rights remain with the original authors. If you believe any content infringes on third-party rights, please contact service@support.mexc.com for removal. MEXC makes no guarantees regarding the accuracy, completeness, or timeliness of the content and is not responsible for any actions taken based on the information provided. The content does not constitute financial, legal, or other professional advice, nor should it be considered a recommendation or endorsement by MEXC.

You May Also Like

Avalanche Now Hosts First South Korean Won-Based Stablecoin

Avalanche Now Hosts First South Korean Won-Based Stablecoin

BDACS has launched KRW1, the first Korean won-backed stablecoin, on the Avalanche blockchain. The post Avalanche Now Hosts First South Korean Won-Based Stablecoin appeared first on Coinspeaker.
Share
Coinspeaker2025/09/18 18:05
Unlock Yield: Upshift, Clearstar & Flare Launch New earnXRP Product

Unlock Yield: Upshift, Clearstar & Flare Launch New earnXRP Product

BitcoinWorld Unlock Yield: Upshift, Clearstar & Flare Launch New earnXRP Product For XRP holders seeking more than just price appreciation, a new opportunity has
Share
bitcoinworld2025/12/22 22:30
North America Sees $2.3T in Crypto

North America Sees $2.3T in Crypto

The post North America Sees $2.3T in Crypto appeared on BitcoinEthereumNews.com. Key Notes North America received $2.3 trillion in crypto value between July 2024 and June 2025, representing 26% of global activity. Tokenized U.S. treasuries saw assets under management (AUM) grow from $2 billion to over $7 billion in the last twelve months. U.S.-listed Bitcoin ETFs now account for over $120 billion in AUM, signaling strong institutional demand for the asset. . North America has established itself as a major center for cryptocurrency activity, with significant transaction volumes recorded over the past year. The region’s growth highlights an increasing institutional and retail interest in digital assets, particularly within the United States. According to a new report from blockchain analytics firm Chainalysis published on September 17, North America received $2.3 trillion in cryptocurrency value between July 2024 and June 2025. This volume represents 26% of all global transaction activity during that period. The report suggests this activity was influenced by a more favorable regulatory outlook and institutional trading strategies. A peak in monthly value was recorded in December 2024, when an estimated $244 billion was transferred in a single month. ETFs and Tokenization Drive Adoption The rise of spot Bitcoin BTC $115 760 24h volatility: 0.5% Market cap: $2.30 T Vol. 24h: $43.60 B ETFs has been a significant factor in the market’s expansion. U.S.-listed Bitcoin ETFs now hold over $120 billion in assets under management (AUM), making up a large portion of the roughly $180 billion held globally. The strong demand is reflected in a recent resumption of inflows, although the products are not without their detractors, with author Robert Kiyosaki calling ETFs “for losers.” The market for tokenized real-world assets also saw notable growth. While funds holding tokenized U.S. treasuries expanded their AUM from approximately $2 billion to more than $7 billion, the trend is expanding into other asset classes.…
Share
BitcoinEthereumNews2025/09/18 02:07