Ethereum Price Today: ETH Struggles Below $3,000, Market in Extreme Fear

In a context of heightened nervousness in the crypto markets, the price of Ethereum today remains pressed below the $3,000 area, with the technical outlook still dominated by sellers.
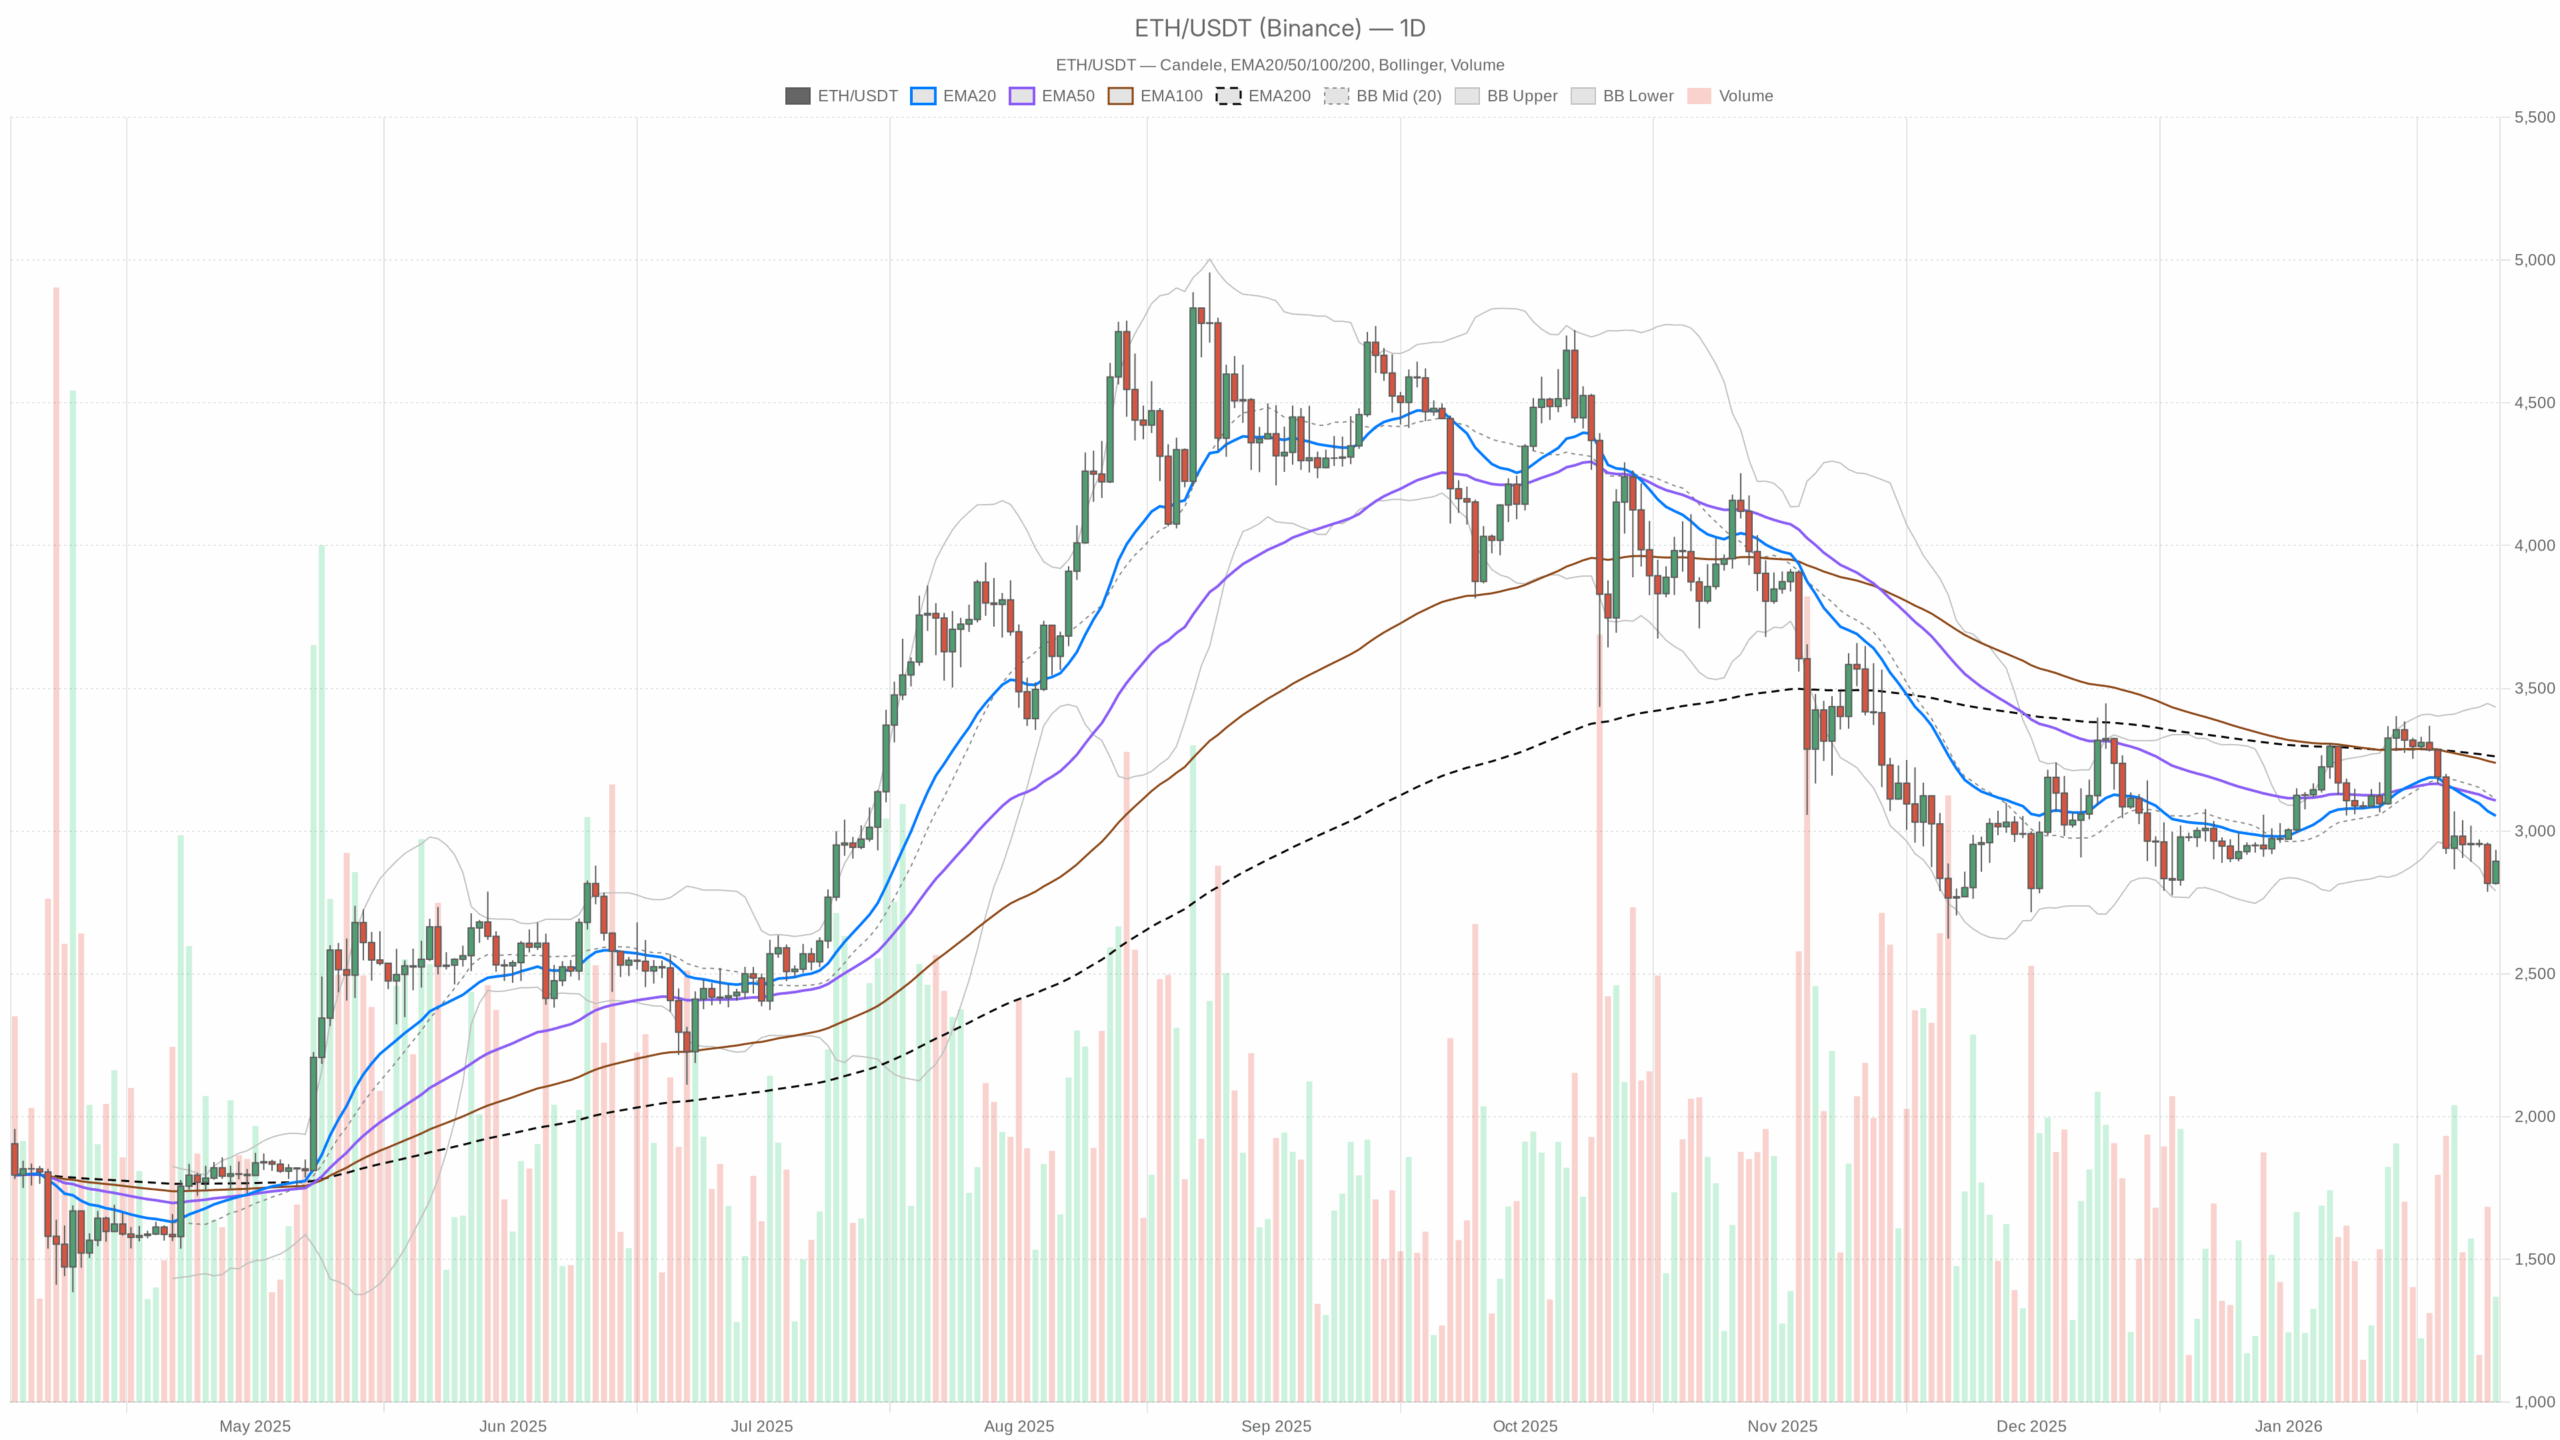 ETH/USDT with EMA20, EMA50 and volumes”
loading=”lazy” />ETH/USDT — daily chart with candles, EMA20/EMA50 and volumes.
Ethereum Trend Today: Daily (D1) Outlook Still Bearish
On the daily chart, the main trend is classified as bearish. This defines the underlying direction, and from here we start to understand whether it makes sense to consider entries on ETH or if more patience is needed.
- Closing Price D1: $2,894.5
- EMA 20: $3,053.5
- EMA 50: $3,107.15
- EMA 200: $3,261.62
Significant distance below all three averages, with the fastest (20) exceeding the price by over $150. This indicates a market where every recovery attempt is absorbed before reaching the $3,050–3,100 area. Essentially, Ethereum’s real-time value is in a technical discount, but not yet in a zone where buyers are enforcing a true reversal.
Daily RSI (Strength/Weakness Sentiment)
- RSI 14 D1: 39.15
The RSI is below the equilibrium threshold but not in oversold territory. This indicates structural weakness, not panic. Sellers are in control, but without those extreme extensions that often precede violent rebounds. For now, Ethereum’s trend is set to bearish, but without capitulation.
Daily MACD (Trend Breath)
- MACD line: -52.32
- Signal: -8.62
- Histogram: -43.71
The MACD line remains well below the signal, and the histogram is widely negative. The message is of an ongoing bearish trend, with the selling phase not yet having exhausted its momentum. It is not a “confirmed bottom” structure, but rather one of continuation or consolidation downward.
Daily Bollinger Bands (Volatility and Extreme Levels)
- Central Band (mid): $3,112.27
- Upper Band: $3,433.81
- Lower Band: $2,790.73
- Current Price: $2,894.5
Ethereum is located in the lower part of the channel, just above the lower band. This indicates a price squeezed towards recent lows, with remaining space towards $2,790–2,800 before reaching a statistically extreme area. It is a zone where technical rebounds are often seen, but without confirmations, it is not an automatic “buy the dip”.
Daily ATR (Average Volatility)
- ATR 14 D1: $135.89
An average daily volatility around $135 implies that movements of 4–5% in a session are perfectly normal on ETH. In practice, those watching the price must account for wide intraday swings: stops that are too tight risk being hit even in “normal” movements.
Daily Pivots on D1 (Control Levels)
- Pivot Point (PP): $2,880.42
- Resistance R1: $2,948.48
- Support S1: $2,826.45
The price is slightly above the daily pivot. This means that, for now, buyers are defending the $2,870–2,880 range. As long as we stay above the PP, the market attempts a short-term rebound. However, a clear close below $2,880 would more easily open the way towards $2,830 and, in extension, towards the lower band at $2,790.
Ethereum Intraday Chart: H1 and M15 Show Attempt at Stabilization
While the daily remains bearish, the short term is trying to build a base. This is where the more tactical operation on the price takes place.
H1 Timeframe: Fragile Rebound in the $2,890–2,900 Area
- Price H1: $2,894.25
- EMA 20 H1: $2,882.3
- EMA 50 H1: $2,906.93
- EMA 200 H1: $3,021.97
- RSI 14 H1: 51.73
- MACD H1: line -6.61, signal -16.5, histogram +9.89
- Bollinger mid H1: $2,866.67 (up $2,944.15, low $2,789.2)
- ATR 14 H1: $30.05
- Pivot H1: PP $2,900.27, R1 $2,907.54, S1 $2,886.98
The EMA 20 has been regained and is turning below the price, while the EMA 50 H1 is just above the quotes. The market is trying to transform the $2,880–2,890 area from resistance to support, but has not yet decisively surpassed $2,900–2,910, where the PP/R1/EMA 50 cluster passes.
RSI in the 52 area indicates a slightly favorable balance for buyers in the short term, consistent with the MACD histogram which has turned positive: after a phase of weakness, the hourly momentum is trying to turn upwards. It is not yet a strong trend, but an attempt at recovery within a still adverse daily context.
The Bollinger Bands on H1 show the price in the upper part of the channel, near the pivot R1. Moreover, as long as ETH remains above $2,886–2,890, the trend can remain in intraday rebound mode; a loss of this area would quickly bring the price back towards the central or lower part of the channel and reopen the risk of new daily lows.
M15 Timeframe: Short-Term Micro-Structure
- Price M15: $2,894.26
- EMA 20 M15: $2,888.97
- EMA 50 M15: $2,875.94
- EMA 200 M15: $2,904.45
- RSI 14 M15: 56.21
- MACD M15: line 13.1, signal 12.19, histogram 0.9
- Bollinger mid M15: $2,886.09 (up $2,920.74, low $2,851.44)
- ATR 14 M15: $13.31
- Pivot M15: PP $2,900.27, R1 $2,907.55, S1 $2,886.99
On the 15-minute chart, ETH is building a small consolidation channel above $2,885–2,890. The EMA 20 and 50 run below the price and support it, while the EMA 200 at $2,904 represents the first real “step” to overcome to give continuity to the rebound.
RSI above 55 and slightly positive MACD indicate a short-term advantage for buyers, but the fact that the price is below the intraday pivot ($2,900) suggests that control is not yet complete. Moreover, until we see a stable break above $2,905–2,910, the risk is that every spike will be sold, especially in a generally cautious market context.
Market Sentiment and DeFi: Extreme Fear but Growing Activity
The Fear & Greed index is at 20 – Extreme Fear. Historically, these phases are ambiguous: they often coincide with accumulation areas in the medium term, but in the short term, they can still produce bearish accelerations, as every rebound is sold by the market’s more nervous component.
In the DeFi world, fees on protocols like Uniswap V3 and V4 are sharply increasing on a daily basis. This means that despite the perceived risk, the ecosystem continues to move and generate on-chain activity. For the long-term ETH chart, this is a positive signal of real usage, but in the very short term, it is not enough to reverse the bearish trend on the ETHUSDT pair.
Bullish Scenario on Ethereum: What It Takes for the Rebound to Become More
Currently, the main scenario remains bearish on D1, but a plausible bullish scenario exists if the market can consolidate above certain key thresholds.
Conditions for a Credible Bullish Scenario
- Holding the $2,830–2,880 Support: this is the range that must not break. Defending this area would mean that buyers are starting to accumulate, despite the fear sentiment.
- Break and Confirmation Above $2,950–3,000: here lies the first daily resistance (R1 $2,948) and the psychological threshold of $3,000. A stable daily close above $3,000 would change the market tone from “technical rebound” to “serious recovery attempt”.
- Recovery of the Daily EMA 20 ($3,053) and Subsequently the EMA 50 ($3,107): bringing the price above these averages would transform the recent decline into a simple pullback within a broader trend, opening space to later test the $3,250–3,300 area (near the EMA 200).
Potential Bullish Targets (Step-by-Step):
- First step: $2,950–3,000 (intraday and psychological resistance);
- Second step: $3,050–3,100 (EMA 20/50 D1 area, first real test);
- Next step: $3,250–3,300 (EMA 200 D1 and old congestion area).
Level of Invalidation for the Bullish Scenario: a daily close below $2,790–2,800 (lower Bollinger band) would significantly weaken the structural rebound scenario, opening the door to a deeper corrective extension.
Bearish Scenario on Ethereum: How Far the Correction Can Go
The scenario consistent with the daily indicators is still bearish. The market is in extreme fear, the MACD is negative, and the price is below all reference EMAs.
Conditions for a New Leg Down
- Decisive Loss of the Daily Pivot $2,880: a return below $2,880 with intraday confirmation (H1 and M15 unable to rise again) would reopen space towards $2,830 (S1 daily).
- Break of $2,830: here, buying orders are likely to arrive, but if demand is weak, the technical space up to $2,790 (lower BB band) would quickly open, aided by the relatively high ATR.
- Extension Below $2,790: in this case, we would be talking about a downward exit from the Bollinger Bands, often associated with forced selling phases and panic selling. Not yet the “default case,” but a risk not to be underestimated if sentiment were to deteriorate further.
Potential Bearish Targets:
- Zone $2,830–2,840 (S1 daily, first intermediate support);
- Zone $2,780–2,800 (lower BB band, possible technical rebound area);
- In case of breaking even this range, deeper levels would need to be reassessed, but here we would enter a stress scenario that is not yet confirmed by the data.
Level of Invalidation for the Short-Term Bearish Scenario: a daily close above $3,050–3,100 (EMA 20/50 D1) would significantly weaken the bearish narrative, transforming it at least into a neutral recovery phase.
How to Read Ethereum’s Price if You Want to Trade
The multi-timeframe picture is clear but not simple:
- Daily: bearish direction, price below all EMAs, negative MACD, weak RSI. This advises against chasing rebounds as if they were the start of a new bull market.
- H1: neutral phase with an attempt to recover above $2,886–2,890, improving momentum. It is the timeframe that today decides whether we will have a rebound day or a continuation of the decline.
- M15: slightly bullish consolidation, useful for refining entries and exits but subject to many false signals, given the intraday ATR and extremely fragile sentiment.
For a trader, this context means one precise thing: key levels must be respected, and micro-rebounds should not be read as guaranteed reversals. The risk of false breakouts above $2,900–2,950 is high, as is the risk of fake breakdowns below $2,850 in the presence of stop hunting.
Those considering potential entries should clearly distinguish between:
- Short-term Operations: exploiting the oscillation between $2,830 and $2,950 with reduced size and technical stops beyond the ATR (to avoid noise), accepting a directionally bearish context.
- Slower Perspective (Swing): waiting for clear absorption signals on the daily, such as the stable recovery of $3,050–3,100, or alternatively, a more pronounced selling excess (much lower daily RSI) that offers a better risk/reward ratio in the $2,700–2,800 area, if reached.
The common thread remains one: Ethereum’s chart today shows a phase of pressure but also the first attempts at defense. In between, the margin for timing errors is high. That said, risk management and patience count more than any single signal.
If you want to monitor the markets in real-time with advanced charts and professional tools, you can open an account on Investing.com:
Open your Investing.com account
This section contains a sponsored affiliate link. We may earn a commission but at no additional cost to you.
Disclaimer: The information contained in this article is for informational and educational purposes only and does not constitute financial advice, investment invitation, or solicitation of public savings. Trading cryptocurrencies involves a high level of risk and may not be suitable for all investors. Before making any transaction, carefully consider your objectives, experience, and risk tolerance. You could lose part or all of your invested capital.
You May Also Like

Market Records Largest Long-Term Bitcoin Supply Release In History, Here’s What It Means For BTC

Bitcoin Cash’s rally faces KEY test – Can BCH hold above $500?