

Chainlink (LINK) Price Prediction 2026–2030: Can LINK Reclaim $15.00 Soon?
- LINK remains under short-term bearish pressure after failing to break above key resistance on the daily timeframe.
- The RSI hovering below the neutral 50 level suggests momentum is still weak but gradually improving.
- Long-term outlook remains cautiously optimistic, with $15.00 emerging as a realistic medium-term target if bullish structure rebuilds.
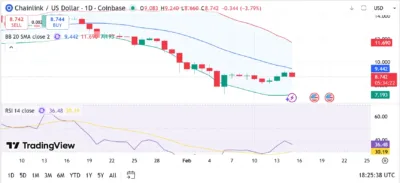
Chainlink (LINK) entered mid-February 2026 trading at approximately $8.74, reflecting a daily decline of nearly 3.8%. The 1D chart shows that LINK remains below the 20-day Simple Moving Average (SMA), confirming continued short-term bearish pressure. Despite minor recovery attempts, the asset has yet to invalidate its pattern of lower highs and lower lows.
The Bollinger Bands indicate that LINK is currently hovering closer to the lower band around $7.19, while the mid-band (20-day SMA) sits near $9.44 and the upper band near $11.69. This positioning reflects recent downside volatility but also hints at potential stabilization.
Also Read: Zora (ZORA) Price Prediction 2026-2030: Can ZORA Hit $0.100 Soon?
Market Sentiment and Momentum
Market sentiment for LINK is currently neutral-to-bearish. Sellers have controlled recent sessions, but the size of bearish candles has reduced, suggesting that downside momentum may be weakening. The consolidation around the $8.60–$8.80 zone signals indecision. Buyers appear to be defending this region, attempting to form a short-term base. For sentiment to shift convincingly bullish, LINK must reclaim the 20-day SMA and begin forming higher lows. If support at $8.60 fails, downside risk increases toward the lower Bollinger Band near $7.20.
Current Market Overview
At the time of analysis, LINK trades at $8.74, still below the 20-day SMA at $9.44, confirming short-term bearish structure. The Bollinger Bands show price compression beginning after a period of expansion, indicating that volatility may soon contract before the next directional move. Trading near the lower band often triggers technical bounces, but sustained recovery requires reclaiming the mid-band. The RSI (14) currently stands at 36.48, below the neutral 50 level but above oversold territory. This suggests weak momentum but not extreme selling conditions.
Technical Analysis
Bollinger Bands
The expanded Bollinger Bands reflect recent volatility. Price trading near the lower band ($7.19) suggests LINK may attempt a bounce. The mid-band (20-day SMA) at $9.44 acts as dynamic resistance. A daily close above this level would mark the first technical sign of recovery. The upper band at $11.69 represents the next major resistance. If LINK consolidates between $8.50 and $9.40, it may build a base before a larger move.
The RSI reading of 36.48 indicates weak but stabilizing momentum. A move above 45–50 would confirm strengthening bullish momentum. Conversely, a drop below 35 could signal renewed selling pressure toward $7.20.
Support and Resistance Levels
Chainlink is currently finding immediate support around the $8.60 region, where recent price action has shown signs of stabilization. A break below this level would expose the next major support at approximately $7.19, which aligns with the lower Bollinger Band and represents a critical defensive zone for buyers. On the upside, immediate resistance stands at $9.44, corresponding with the 20-day Simple Moving Average.
This level acts as dynamic resistance and must be reclaimed to signal short-term recovery. Beyond that, the psychological $10.00 level presents secondary resistance, while the upper Bollinger Band near $11.69 serves as the next major barrier. A sustained breakout above $11.70 would significantly strengthen LINK’s long-term technical structure and could open the path toward the $15.00 psychological level, marking a broader bullish reversal.
Source: Tradingview
LINK Price Predictions (2026–2030)
| Year | Minimum Price | Average Price | Maximum Price |
|---|---|---|---|
| 2026 | $7.20 | $9.50 | $12.00 |
| 2027 | $9.00 | $12.50 | $15.00 |
| 2028 | $11.00 | $15.00 | $18.00 |
| 2029 | $13.00 | $18.50 | $22.00 |
| 2030 | $15.00 | $22.00 | $26.00 |
2026
In 2026, LINK is expected to remain volatile as it transitions from correction toward potential recovery. Holding above $7.20 is critical. If the 20-day SMA is reclaimed, LINK could gradually trend toward $10.00–$12.00 during stronger market phases.
2027
By 2027, improving market sentiment and broader crypto adoption could support a more structured uptrend. Breaking above $12.00 would strengthen bullish structure and open the path toward $15.00.
2028
In 2028, LINK may benefit from renewed ecosystem expansion and increased liquidity. If bullish cycles align, price could approach $18.00.
2029
As LINK matures within the digital asset market, pullbacks may increasingly be viewed as accumulation opportunities. Stronger participation could push price toward the $20.00–$22.00 range.
2030
By 2030, long-term growth and sustained adoption could drive LINK toward $26.00 under favorable market conditions.
Conclusion
Chainlink (LINK) remains in a short-term corrective phase, trading below key moving averages and near lower support levels. While momentum is weak, early stabilization signals suggest downside pressure may be slowing. If LINK reclaims $9.50 and establishes higher lows, a recovery toward $12.00 becomes increasingly likely. Over the longer term, a decisive move above $15.00 would confirm a major structural shift toward sustained bullish momentum.
FAQs
1. What is the current market sentiment for LINK in 2026?
Short-term sentiment is neutral-to-bearish, with early signs of stabilization near support.
2. Is LINK currently oversold?
The RSI at 36.48 shows weak momentum but not deeply oversold conditions.
3. Can LINK hit $15.00 soon?
A move toward $15.00 is possible if LINK breaks above $12.00 and rebuilds bullish structure.
4. What are the key levels to watch for LINK?
Support at $7.20–$8.60 and resistance at $9.44 and $11.69 are critical levels.
5. What is the long-term outlook for LINK?
With favorable market conditions, LINK could trend toward $22.00–$26.00 by 2030.
Also Read: World Mobile Token (WMTX) Price Prediction 2026–2030: Can WMTX Hit $1.85 Soon?
The post Chainlink (LINK) Price Prediction 2026–2030: Can LINK Reclaim $15.00 Soon? appeared first on 36Crypto.
You May Also Like

Michael Saylor: Plans to convert convertible bonds into equity within 3-6 years

South Korea Trade Balance declined to $0B in January from previous $8.74B
