Chia Coin price prediction 2026-2032: Is XCH a good investment?
- Chia’s price outlook points to a climb toward $5 in 2026.
- Our Chia price prediction for 2028 expects the maximum XCH price to be $24.00.
- In 2032, we expect Chia to attain a maximum of $139.92.
Launched in March 2021 by Chia Network Inc., the Chia coin (XCH) was created by Bram Cohen, a famous programmer behind BitTorrent. Different from traditional cryptocurrencies, Chia operates on a unique proof-of-space-and-time consensus mechanism, designed to be more energy-efficient than Bitcoin or Ethereum.
The Chia blockchain rolled out its first beta version in 2019, reaching full mainnet functionality, including transactions and smart contracts, by mid-2021. It was built using its own smart contract language, Chialisp. It positions itself as an expandable, eco-friendly solution for enterprise-level blockchain applications.
Currently, Chia runs on more than 400,000 machines globally, reflecting its strong decentralized infrastructure. It is listed on major crypto exchanges such as Gate.io, KuCoin, OKX, Huobi, and Uniswap (V2), giving it broad accessibility within the crypto market.
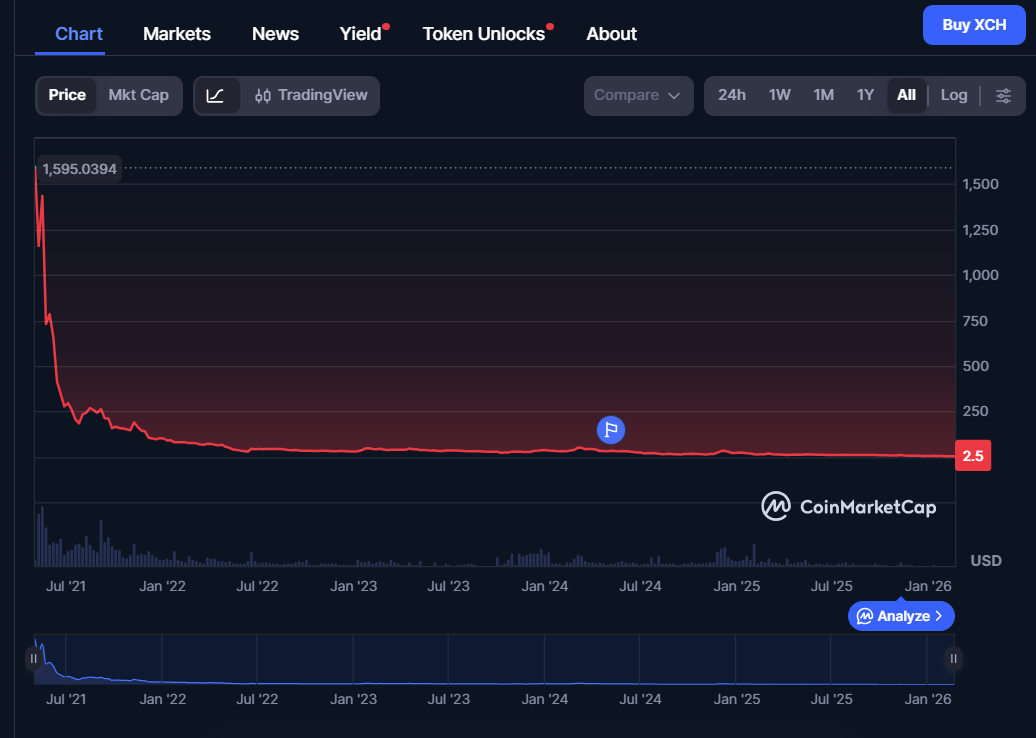
After reaching an all-time high of $1,934.51 in May 2021, the price of chia has gone down to a record all-time low of $2.51 on Feb 22, 2026. This drop highlights how volatile the XCH market can be.
In this article, let’s explore the Chia coin price prediction for 2026 to 2032, and learn about the factors influencing its current value, as well as how the Chia price forecast looks in both the short term and the long term.
Overview
| Cryptocurrency | Chia Coin |
| Token | XCH |
| Price | $2.597 |
| Market Cap | $37.5M |
| Trading Volume | $2.07M |
| Circulating Supply | 14.41M XCH |
| All-time High | $1,934.51, May 03, 2021 |
| All-time Low | $2.51 on Feb 22, 2026 |
| 24-hour High | $2.70 |
| 24-hour Low | $2.51 |
Chia Coin technical analysis
| Metric | Value |
| Price Prediction | $ 2.41 (-7.01%) |
| Volatility | 15.36% (Very High) |
| 50-Day SMA | $ 4.14 |
| 14-Day RSI | 30.05 (Neutral) |
| Sentiment | Bearish |
| Fear & Greed Index | 8 (Extreme Fear) |
| Green Days | 11/30 (37%) |
| 200-Day SMA | $ 6.92 |
Chia price analysis
- XCH has dropped to $2.59 after printing a new all-time low of $2.51 in the last 24hours.
- Current XCH resistance is between $2.63 and $2.65, and then $2.70.
- The immediate Support forms at $2.51, with $2.50 as the next key floor.
As of Feb 22, 2026, the Chia is trading around $2.597, down by 2.16% over the last 24 hours, with the day’s range between $2.51 and $2.70. In the last hours, XCH recorded a new all-time low of $2.51, before bouncing up slightly off that level.
XCH price analysis 1-day chart: Oversold RSI signals seller exhaustion
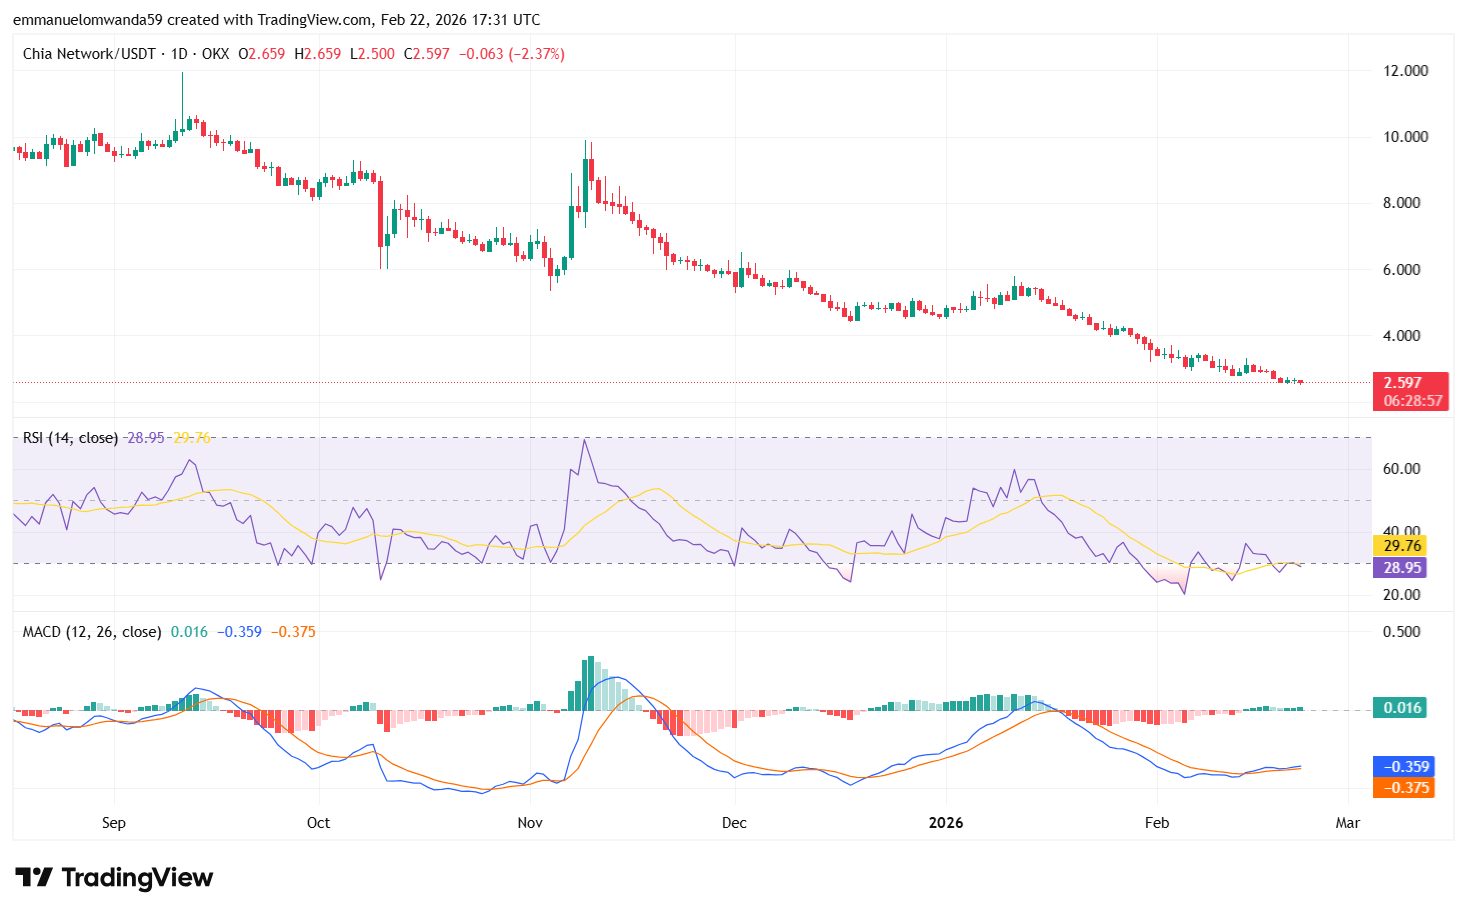
On the 24-hour chart, Bears remain in control despite oversold signals. Over the last 24hours XCH opened at $2.659, posted a high of $2.659, fell to a low of $2.500, and closed at $2.597, ending the session down 2.16%.
 XCH/USDT Chart: TradingView
Momentum remains weak. The RSI (14) sits at 28.95, keeping XCH in oversold territory. The MACD still reflects bearish conditions, with the MACD line at -0.359 versus the signal line at -0.375, while the histogram reads 0.016, suggesting downside momentum is easing slightly but has not flipped trend.
Immediate support sits at $2.51, followed by $2.50. On the upside, buyers need a push above $2.63 and $2.65 to stabilize, while $2.70 remains the near-term ceiling.
XCH/USD 4-hour price chart
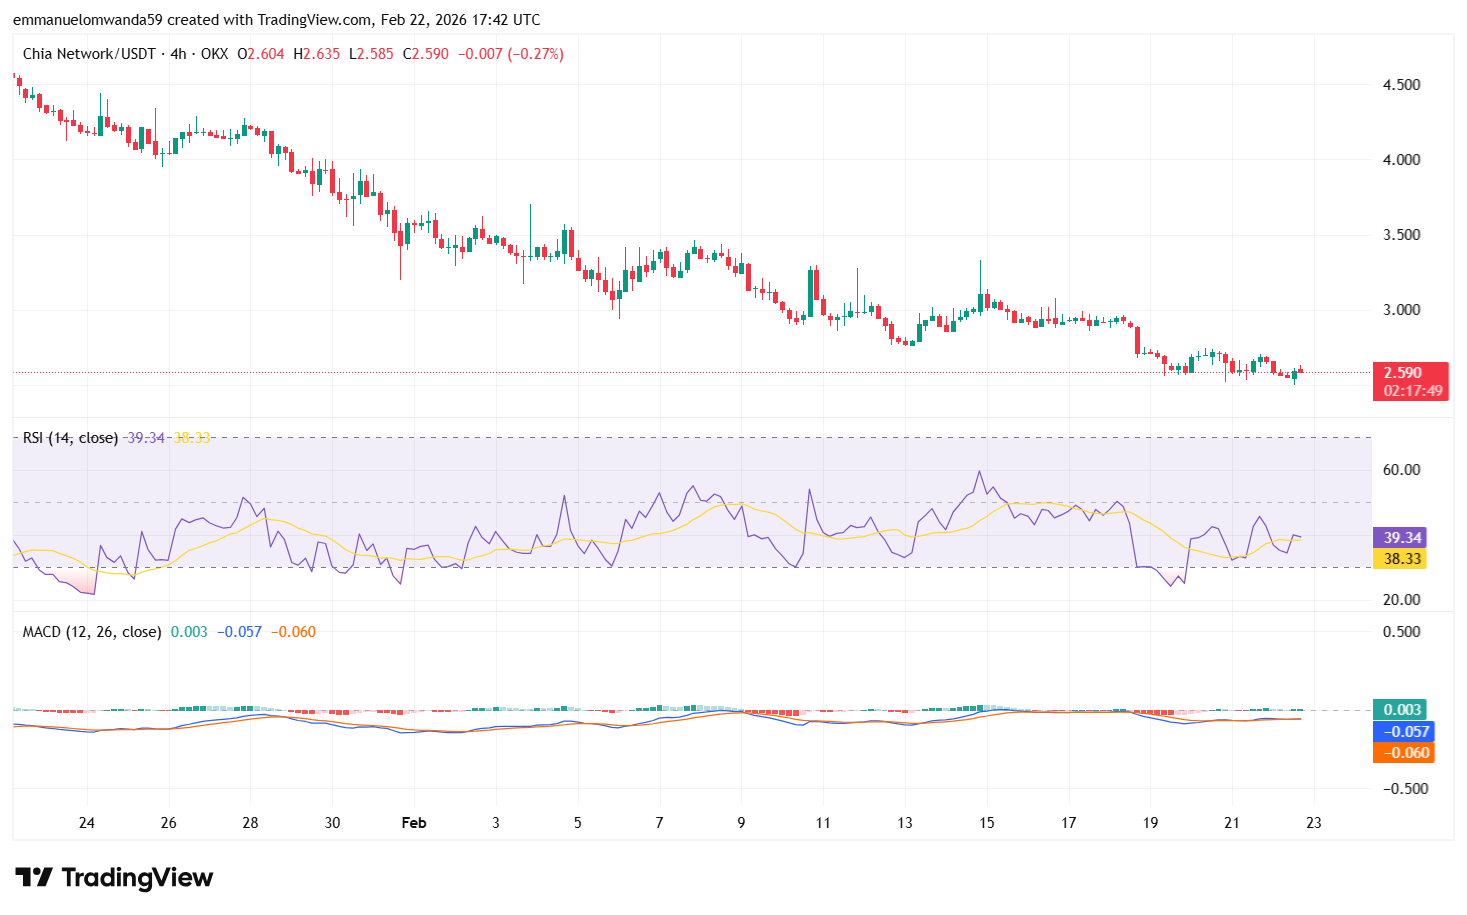
On the 4-hour timeframe, XCH is struggling to build momentum after the drop, with price m6ov5ing near $2.590. The latest candle opened at $2.604, pushed to a high of $2.635, dropped to a low of $2.585, and closed at $2.590, slipping 0.27%.
Momentum indicators remain mixed but still lean bearish. The RSI (14) sits at 39.34, showing weak demand below the neutral zone. The MACD is still negative, with the MACD line at -0.057 and the signal line at -0.060, while the histogram is near 0.003, suggesting sellers are losing some control, but buyers have not taken over.
Immediate support sits at $2.58 and $2.55, with $2.51 and $2.50 as the deeper downside levels. On the upside, resistance stands at $2.63 and $2.65, followed by $2.70.
 XCH/USDT Chart: TradingView
XCH technical indicators: Levels and action
Daily simple moving average (SMA)
| Period | Value | Action |
| SMA 3 | $3.47 | SELL |
| SMA 5 | $3.14 | SELL |
| SMA 10 | $3.03 | SELL |
| SMA 21 | $3.15 | SELL |
| SMA 50 | $ 4.14 | SELL |
| SMA 100 | $ 4.92 | SELL |
| SMA 200 | $ 6.92 | SELL |
Daily exponential moving average (EMA)
| Period | Value | Action |
| EMA 3 | $ 3.41 | SELL |
| EMA 5 | $ 3.78 | SELL |
| EMA 10 | $ 4.22 | SELL |
| EMA 21 | $ 4.57 | SELL |
| EMA 50 | $ 5.21 | SELL |
| EMA 100 | $ 6.19 | SELL |
| EMA 200 | $ 7.90 | SELL |
What to expect from the XCH price next?
XCH may stay range-bound between $2.58 and $2.65 unless buyers reclaim $2.70 for a stronger rebound. If price breaks below $2.58, it could revisit $2.51–$2.50 quickly.
Is Chia Coin a good investment?
Based on the current bearish trend, heightened volatility, and strong selling pressure indicated by technical indicators like the RSI and moving averages, Chia Coin (XCH) may not be considered a favourable investment at this time. Investors should exercise caution due to the uncertain market direction and potential for further price declines in the near term.
Why is XCH’s price down today?
XCH fell mainly because the wider crypto market stayed risk-off, with Bitcoin weakness linked to ongoing spot ETF outflows dragging high-beta altcoins lower. No strong Chia-specific catalyst showed up, so price action remains bearish below $2.64 and $2.78, with $2.50 the key downside level to watch.
Will XCH recover?
The recovery of Chia XCH depends on reversing the current bearish sentiment and stabilizing market conditions and real-world events. Watch for signs of decreased selling pressure, potential positive catalysts, and a shift in technical indicators indicating oversold conditions in the relative strength index (RSI), which could signal a potential recovery in future price movements.
Will XCH reach $25?
According to the latest data price of XCH could reach up to $25 soon. Analysts suggest this could happen as early as 2028 if current sentiment continue potentially reaching $26
Will XCH reach $50?
The forecast for 2029 anticipates a peak price of $55, indicating that XCH could potentially surpass the $50 mark during that year, assuming the bullish scenario and positive market conditions persist.
Will XCH reach $200?
For XCH, to exceed the $200 mark would depend on sustained growth, market dynamics, and broader adoption factors.
Does XCH have a good long-term future?
The long-term price predictions from 2026 to 2032 indicate a generally positive outlook for Chia Coin, with projected growth in average and maximum prices over the years. This suggests the potential for XCH to establish itself as a valuable asset in the cryptocurrency market, subject to market developments and adoption trends.
Recent news/opinion on Chia Coin
Chia Network has entered a purchase agreement with NoSSD as it moves toward Proof of Space 2.0 and the Chia 3.0 release, citing NoSSD’s plotting technology and community contributions. The company added that the NoSSD pool will keep operating until Proof of Space 1.0 plots become invalid, after which NoSSD will not update to the new plot format, while Chia plans to finalize CHIP-48 and CHIP-49 and ship updated plotting software with Chia 3.0.
Chia coin price prediction February 2026
As for February 2026, the Chia price is forecast to range from $2.50 to $3.26, with an average closing price of around $2.88.
| XCH price prediction | Minimum Price | Average Price | Maximum Price |
| XCH price prediction February 2026 | $2.50 | $2.88 | $3.26 |
Chia (XCH) price prediction 2026
Chia price is forecast to reach a lowest level of $2.5 in 2026. The price of chia could reach a highest price level of $5.00 with the average chia forecast price of $3.78.
| XCH Price Prediction | Minimum Price | Average Price | Maximum Price |
| XCH Price Prediction 2026 | $2.5 | $3.78 | $5.00 |
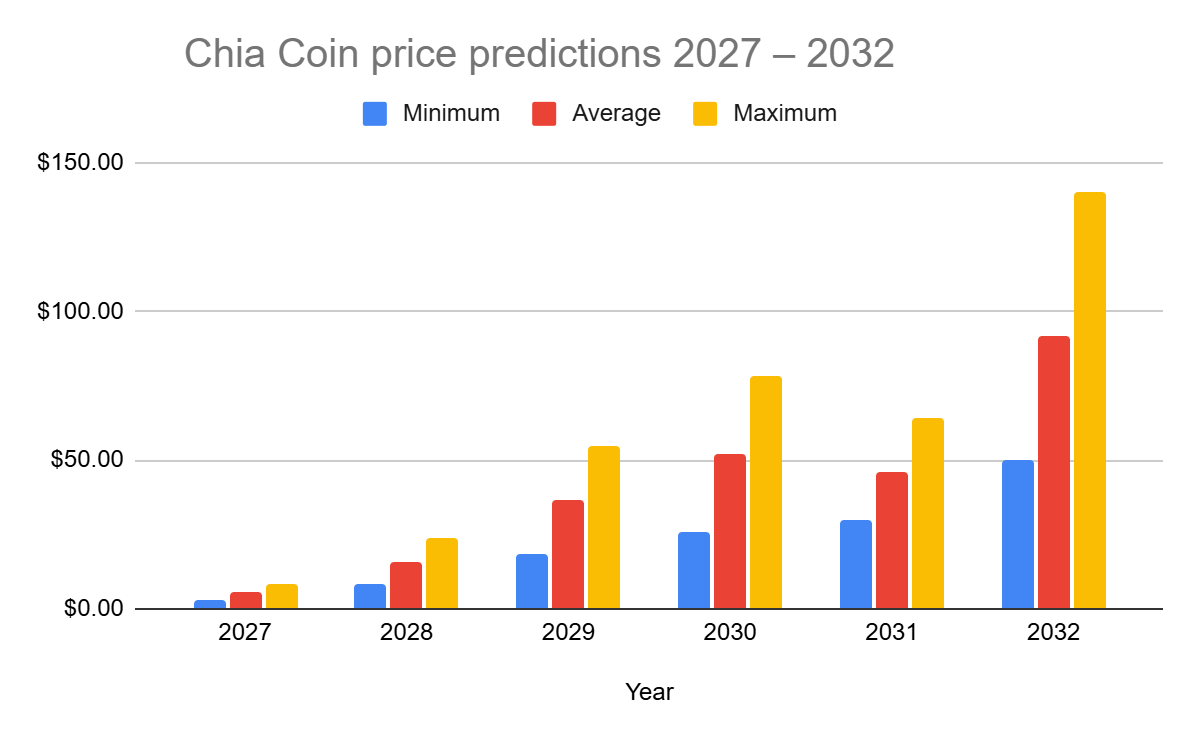
Chia Coin price predictions 2027 – 2032
| Year | Minimum | Average | Maximum |
| 2027 | $2.75 | $5.39 | $8.42 |
| 2028 | $8.60 | $15.79 | $24.00 |
| 2029 | $18.20 | $36.60 | $55.00 |
| 2030 | $26.00 | $52.00 | $78.00 |
| 2031 | $29.82 | $45.88 | $64.23 |
| 2032 | $50.17 | $92.05 | $139.92 |
chia price prediction 2027
As per the forecast and technical analysis on XCH, in 2027, the price is expected to reach a minimum value of $2.75. The XCH price could hit a maximum value of $8.42, with an average price of $5.39.
chia price prediction 2028
Based on the forecast and past price trends, in 2028, Chia is projected to trade at a minimum of $8.60. The XCH price could climb to a maximum of $24.00, with an average trading price of $15.79.
chia price prediction 2029
According to the forecast and technical outlook, in 2029, the price of Chia is expected to sit around a minimum of $18.20. The XCH price could reach a maximum of $55.00, with an average price of $36.60.
chia price prediction 2030
As per the forecast and technical analysis, in 2030, Chia is predicted to reach a minimum value of $26.00. The XCH price could rise to a maximum of $78.00, with an average trading price of $52.00..
Chia price prediction 2031
Based on the forecast and market trend analysis, in 2031, Chia is expected to have a minimum price of $29.82. The XCH price could reach a maximum of $64.23, with an average trading price of $45.88.
chia price prediction 2032
As per the forecast and long-term technical outlook, in 2032, Chia is projected to trade at a minimum of $50.17. The XCH price could reach a maximum of $139.92, with an average price of $92.05.
 Chia Price Prediction 2026-2032
Chia Coin market price prediction: Analysts’ XCH price forecast
| Firm Name | 2026 | 2027 |
| Changelly | $7.05 | $10.50 |
| SwapSpace | $6.4526 | $9.4703 |
Cryptopolitan’s Chia Coin (XCH) price prediction
Per Cryptopolitan’s Chia price is forecast to reach a lowest level of $2.5 in 2026. The price of chia could reach a highest price level of $5.00 with the average chia forecast price of $3.78.
Chia Coin historic price sentiment
 Chia Price History
- XCH started 2022 strong at $80.71 but declined sharply, dropping to $34.56 by May and $36.42 by August, reflecting bearish sentiment and market volatility.
- By December 2022, XCH showed a modest recovery to $37.80, hinting at stabilisation and renewed investor confidence.
- In 2023, XCH started strong, climbing 58.11% to $45.44 in January and maintaining bullish momentum until April at $39.00 before dropping to $34.11 in May amid corrections.
- After hitting a low of $27.77 in September, XCH rebounded significantly to $37.80 in December, reflecting renewed investor interest and potential recovery.
- XCH started 2024 at $29.42 but steadily declined to $23.26 by May and further to $19.54 in July, reflecting bearish trends and market challenges.
- By December 2024, XCH hovered around $20-$21, showing sustained selling pressure and ongoing downward momentum.
- In January 2025, XCH’s decline intensified, dropping the price sharply to $20.
- By February, XCH hit its lowest price on record at $8.61, reflecting extreme selling pressure and weak investor sentiment.
- From March to May, the chia price began a slow recovery, fluctuating between $10 and $11 as market conditions gradually stabilized.
- As of 2025, the XCH traded at $11.52, up over 34% from its February low, signalling a potential trend reversal and renewed interest in the chia market.
- XCH started 2026 under fresh selling pressure, and by February 22, 2026, it recorded a new all-time low of $2.51, reflecting extreme bearish sentiment and heavy downside volatility.


You May Also Like

Your guide to Disney Adventure’s 7 themed areas

This startup is building an ‘intelligence layer’ for Nigeria’s power grid