USDT’s 60-day market cap change has fallen below -$3 billion, a threshold reached only once before, during late 2022 when Bitcoin based near $16,000. The secondUSDT’s 60-day market cap change has fallen below -$3 billion, a threshold reached only once before, during late 2022 when Bitcoin based near $16,000. The second

USDT 60-Day Contraction Drops Below -$3B as Bitcoin Trades $65K–$70K

2026/02/23 11:14
3 min read

USDT’s 60-day market cap change has fallen below -$3 billion, a threshold reached only once before, during late 2022 when Bitcoin based near $16,000.

The second occurrence is unfolding now, in early 2026, with BTC trading in the $65,000–$70,000 range following its prior all-time high expansion.

The magnitude of the contraction places stablecoin liquidity at the center of current market structure. This is not a routine fluctuation. It reflects sustained capital withdrawal from the crypto ecosystem over a compressed period.

Rare Liquidity Signal Reappears

Stablecoins function as deployable liquidity across the digital asset market. When supply expands, it typically signals fresh capital entering exchanges and on-chain venues. When supply contracts aggressively, it implies redemptions, deleveraging, or capital exiting the ecosystem.

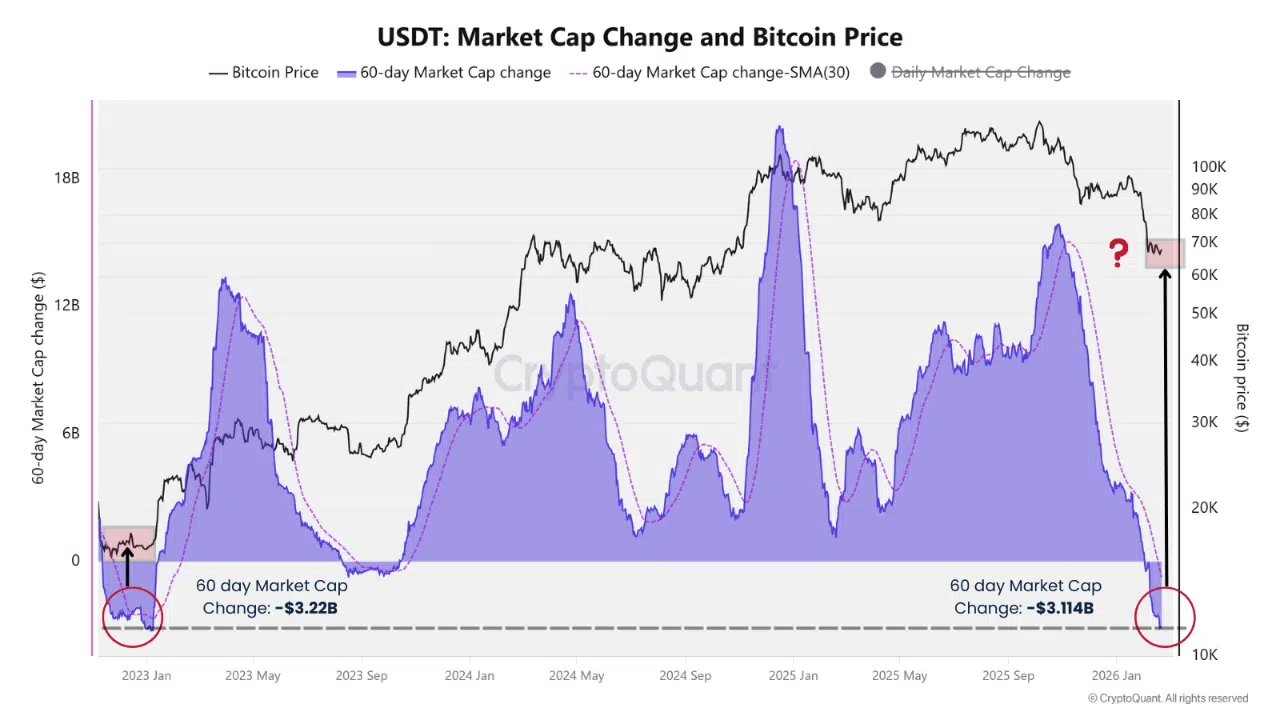
The 60-day USDT contraction below -$3 billion has occurred on only two occasions:

  • Late 2022: Bitcoin traded near $16,000, marking a cycle low amid peak capitulation.
  • Early 2026: Bitcoin trades between $65,000 and $70,000 after a prior all-time high phase.

The structural difference in price level makes the comparison more complex. In 2022, the contraction aligned with systemic stress and forced selling. Today, the contraction is occurring from significantly higher valuation levels, suggesting liquidity tightening rather than full-cycle collapse.

Daily Outflows Add to the Stress Signal

On a daily basis, USDT has printed three separate single-day outflows exceeding -$1 billion. Historically, episodes of this scale have aligned with either macro bottoms or volatility clusters in Bitcoin.

Large-scale redemptions typically reflect institutional or large-holder activity rather than retail flows. When redemptions accelerate at this magnitude, they often coincide with exhaustion phases, periods where forced positioning unwinds rather than the early stages of sustained structural downtrends.

That distinction matters. Liquidity exits can precede either stabilization or further downside depending on whether the contraction persists.

Bitcoin’s Liquidity Sensitivity

Bitcoin remains deeply reflexive to liquidity conditions. When stablecoin supply compresses, the available on-exchange buying power shrinks. That creates a more fragile environment, especially during periods of heightened volatility.

The current 60-day contraction suggests structural tightening in crypto-native liquidity. If redemptions continue at this pace, downside pressure could extend as market depth thins and risk appetite remains subdued.

However, historical precedent shows that once forced deleveraging phases complete and stablecoin flows stabilize, Bitcoin has often transitioned into strong medium-term recoveries as liquidity normalizes.

Smart Money Buys the Dip as 1,000+ BTC Whales Accumulate

Stabilization Is the Inflection Variable

The key variable is not the depth of contraction alone, but whether flows begin to flatten.

If USDT supply continues to decline, structural pressure may persist. If the contraction slows or reverses, the risk-reward profile shifts rapidly, as even modest liquidity expansion can have an outsized effect in a reflexive market.

Extreme liquidity stress has historically marked opportunity, but only after selling exhaustion is confirmed. For now, Bitcoin trades in a tightening liquidity regime, and stabilization in USDT flows remains the condition that could redefine the next structural phase.

The post USDT 60-Day Contraction Drops Below -$3B as Bitcoin Trades $65K–$70K appeared first on ETHNews.

Market Opportunity
Bitcoin Logo
Bitcoin Price(BTC)
$66,328.32
$66,328.32$66,328.32
-2.00%
USD
Bitcoin (BTC) Live Price Chart
Disclaimer: The articles reposted on this site are sourced from public platforms and are provided for informational purposes only. They do not necessarily reflect the views of MEXC. All rights remain with the original authors. If you believe any content infringes on third-party rights, please contact service@support.mexc.com for removal. MEXC makes no guarantees regarding the accuracy, completeness, or timeliness of the content and is not responsible for any actions taken based on the information provided. The content does not constitute financial, legal, or other professional advice, nor should it be considered a recommendation or endorsement by MEXC.

You May Also Like

Exploring Market Buzz: Unique Opportunities in Cryptocurrencies

Exploring Market Buzz: Unique Opportunities in Cryptocurrencies

In the ever-evolving world of cryptocurrencies, recent developments have sparked significant interest. A closer look at pricing forecasts for Cardano (ADA) and rumors surrounding a Solana (SOL) ETF, coupled with the emergence of a promising new entrant, Layer Brett, reveals a complex market dynamic. Cardano's Prospects: A Closer Look Cardano, a stalwart in the blockchain space, continues to hold its ground with its research-driven development strategy. The latest price predictions for ADA suggest potential gains, predicting a double or even quadruple increase in its valuation. Despite these optimistic forecasts, the allure of exponential gains drives traders toward more speculative ventures. The Buzz Around Solana ETF The potential introduction of a Solana ETF has the crypto community abuzz, potentially catapulting SOL prices to new heights. As investors await regulatory decisions, the impact of such an ETF on Solana's value could be substantial, potentially reaching up to $300. However, as with Cardano, the substantial market capitalization of Solana may temper its growth potential. Why Layer Brett is Gaining Traction Amidst established names, a new contender, Layer Brett, has started to capture the market's attention with its early presale stages. Offering a low entry price of just $0.0058 and promising over 700% in staking rewards, Layer Brett presents a tempting proposition for those looking to maximize returns. Comparative Analysis: ADA, SOL, and $LBRETT While both ADA and SOL offer stable investment choices with reliable growth, Layer Brett emerges as a high-risk, high-reward option that could potentially offer significantly higher returns due to its nascent market position and aggressive economic model. Initial presale pricing lets investors get in on the ground floor. Staking rewards currently exceed 690%, a persuasive incentive for early adopters. Backed by Ethereum's Layer 2 for enhanced transaction speed and reduced costs. A community-focused $1 million giveaway to further drive engagement and investor interest. Predicted by some analysts to offer up to 50x returns in coming years. Shifting Sands: Investor Movements As the crypto market landscape shifts, many investors, including those traditionally holding ADA and SOL, are beginning to diversify their portfolios by turning to high-potential opportunities like Layer Brett. The combination of strategic presale pricing and significant staking rewards is creating a momentum of its own. Act Fast: Time-Sensitive Opportunities As September progresses, opportunities to capitalize on these low entry points and high yield offerings from Layer Brett are likely to diminish. With increasing attention and funds being directed towards this new asset, the window to act is closing quickly. Invest in Layer Brett now to secure your position before the next price hike and staking rewards reduction. For more information, visit the Layer Brett website, join their Telegram group, or follow them on X by clicking the following links: Website Telegram X Disclaimer: This is a sponsored press release and is for informational purposes only. It does not reflect the views of Bitzo, nor is it intended to be used as legal, tax, investment, or financial advice.
Share
Coinstats2025/09/18 18:39
Tests 50-day EMA barrier near 183.00

Tests 50-day EMA barrier near 183.00

The post Tests 50-day EMA barrier near 183.00 appeared on BitcoinEthereumNews.com. EUR/JPY remains steady after three days of gains, trading around 182.70 during
Share
BitcoinEthereumNews2026/02/23 17:03
Moonshot MAGAX vs Shiba Inu: The AI-Powered Meme-to-Earn Revolution Challenging a Meme Coin Giant

Moonshot MAGAX vs Shiba Inu: The AI-Powered Meme-to-Earn Revolution Challenging a Meme Coin Giant

Discover how Moonshot MAGAX’s AI-powered meme-to-earn platform outpaces Shiba Inu with innovative tokenomics and growth potential in 2025.
Share
Blockchainreporter2025/09/18 03:15