We obtained reed bees from the Dandenong Ranges National Park, Victoria, Australia (lat. -37.90, long 145.37) These bees exhibit semi-social behaviour and construct their nests within the pithy stems of fern fronds and other plants. We placed each insect in a separate container to facilitate individual id for testing. In order to run the experiment over several days, insects were refrigerated overnight below 4°C. After warming up, each bee was individually recorded daily in an arena. Here it was illuminated by an overhead ring light and videoed using a Dino-Lite digital microscope for 30–50 seconds per session at 30 fps.We obtained reed bees from the Dandenong Ranges National Park, Victoria, Australia (lat. -37.90, long 145.37) These bees exhibit semi-social behaviour and construct their nests within the pithy stems of fern fronds and other plants. We placed each insect in a separate container to facilitate individual id for testing. In order to run the experiment over several days, insects were refrigerated overnight below 4°C. After warming up, each bee was individually recorded daily in an arena. Here it was illuminated by an overhead ring light and videoed using a Dino-Lite digital microscope for 30–50 seconds per session at 30 fps.

A New Era of Markerless Insect Tracking Technology Has been Unlocked by Retro-ID

2025/09/01 20:32

Abstract and 1. Introduction

  1. Related Works
  2. Method
  3. Results and Discussion
  4. Conclusion and References

2. Related Works

Explicit recognition of retro-id’s value as distinct from reid, and a need to test its performance are, to the best of our knowledge, novel. Re-id however, is well researched for human faces [12, 13, 19, 20, 24], and somewhat so for insects [2–4, 11, 14–16]. Insect re-id algorithms may rely on small markers or tags attached to an insect to track it over separate observations [2, 4, 14, 15]. Six ant colonies were monitored using tags over 41 days, collecting approximately nine million social interactions to understand their behaviour [14]. BEETag, a tracking system using bar codes, was used for automated honeybee tracking [4], and Boenisch et al. [2] developed a QR-code system for honeybee lifetime tracking. Meyers et al. [15] demonstrated automated honeybee re-id by marking their thoraxes with paint, while demonstrating the potential of markerless reid using their unmarked abdomens. Markerless re-id has been little explored. The study of Giant honeybees’ wing patterns using size-independent characteristics and a selforganising map was a pioneering effort in non-invasive reid [11]. Convolutional neural networks have been used for markerless fruit fly re-id [16] and triplet-loss-based similarity learning approaches have also been used to re-id Bumble bees returning to their nests [3].

\ All these studies adopt chronological re-id despite many highly relevant scenarios where this is inefficient. Our study therefore explores retro-id as a novel complementary approach to tracking individual insects for ecological and biological research.

3. Method

3.1. Data Collection

We obtained reed bees from the Dandenong Ranges National Park, Victoria, Australia (lat. -37.90, long. 145.37)[1]. These bees exhibit semi-social behaviour and construct their nests within the pithy stems of fern fronds and other plants [5]. Each nest can consist of several females who share brood-rearing and defence responsibilities. We placed each insect in a separate container to facilitate individual id for testing. In order to run the experiment over several days, insects were refrigerated overnight below 4°C. After warming up, each bee was individually recorded daily in an arena. Here it was illuminated by an overhead ring light and videoed using a Dino-Lite digital microscope for 30–50 seconds per session at 30 fps. We followed the process listed below to create our final datasets.

\

  1. Video Processing: Bee videos were processed frame by frame. To automate this, we trained a YOLO-v8 model to detect a bee’s entire body, head, and abdomen in each frame. This enabled automatic establishment of the bee’s orientation in the frame.

    \

  2. Image Preparation: Upon detection, bees were cropped from the frames using the coordinates provided by Step 1To align bees, we rotated frames using a bee’s orientation before cropping. Centred on the detected entire bee body, a 400x400 pixel region (determined empirically for our bee/microscope setup) was cropped, then resized to 256x256.

    \

  3. Contrast Adjustment: To enhance image quality and ensure uniform visibility across all samples, Contrast Limited Adaptive Histogram Equalisation (CLAHE) [18] was applied.

    \

  4. Quality Control: Manual inspection to remove misidentified objects maintained dataset integrity and ensured only bee images were included.

    \

  5. Dataset Segregation: The final dataset was divided into image subsets, each from a single session, to avoid temporal data leakage.

\ Using Steps 1–5, we curated a dataset of daily bee recording sessions across five consecutive days. Each session included the same 15 individuals videoed for approximately 1200 images/session (total dataset approximately 90K images).

3.2. Network Architecture, Training, Evaluation

We used a transfer-learning-based approach for re-/retro-id of the reed bees. All models were pre-trained on the ImageNet dataset [6] and subsequently fine-tuned using our own dataset. To identify suitable transfer-learning models, we selected 17 different models distributed across 10 different model architectures and parameter numbers ranging from 49.7 million in swinv2s to 0.73 million parameters in squeezenet1_0. To evaluate the models, we collected a second set of data on Day 5, “set-2”, four hours from the first set using Steps 1–5 (above). We trained all 17 models on the first set of Day 5 data. The 17 models were then evaluated based on their ability to re-id individuals in Day 5 set2 data. From them, we selected the seven models with the highest Accuracy (and F1) scores for further consideration. We then trained this top-7 on our original Day 1 and Day 5 data. We evaluated Day 1 models forward on Day 2–5 data and Day 5 models back in time on Day 4–1 data to conduct our main experiments. These forward and backwards evaluations allowed comparison of markerless re- and retro- id of individual insects. The training process was similar for all of the models we considered. We have used Adam Optimiser with a learning rate of 0.001 with 0.0001 weight decay, with a total 100 epochs on the training dataset. We used cross-entropy loss as the loss function for these models.
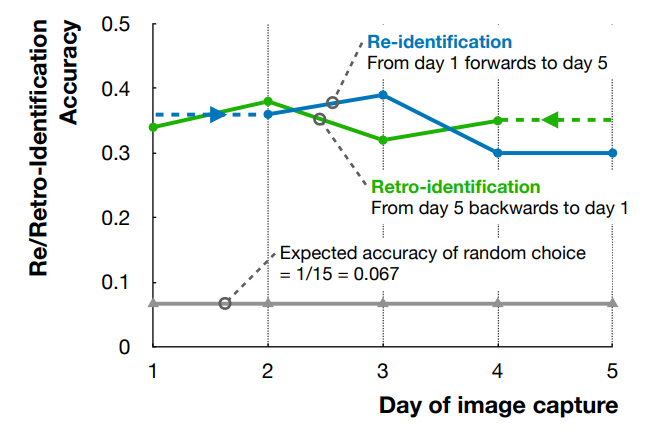
Figure 2. Re/retro-identification accuracy of regnet y 3 2gf model where re-identification is shown as forward identification from day 1-5, and retro-identification is shown as backward identification from day 5-1.

\

:::info Authors:

(1) Asaduz Zaman, Dept. of Data Science and Artificial Intelligence, Faculty of Information Technology, Monash University, Australia (asaduzzaman@monash.edu);

(2) Vanessa Kellermann, Dept. of Environment and Genetics, School of Agriculture, Biomedicine, and Environment, La Trobe University, Australia (v.kellermann@latrobe.edu.au);

(3) Alan Dorin, Dept. of Data Science and Artificial Intelligence, Faculty of Information Technology, Monash University, Australia (alan.dorin@monash.edu).

:::


:::info This paper is available on arxiv under CC BY 4.0 DEED license.

:::

\

Disclaimer: The articles reposted on this site are sourced from public platforms and are provided for informational purposes only. They do not necessarily reflect the views of MEXC. All rights remain with the original authors. If you believe any content infringes on third-party rights, please contact service@support.mexc.com for removal. MEXC makes no guarantees regarding the accuracy, completeness, or timeliness of the content and is not responsible for any actions taken based on the information provided. The content does not constitute financial, legal, or other professional advice, nor should it be considered a recommendation or endorsement by MEXC.

You May Also Like

Developers of Altcoin Traded on Binance Reveal Reason for Major Price Drop – “Legal Process Has Begun”

Developers of Altcoin Traded on Binance Reveal Reason for Major Price Drop – “Legal Process Has Begun”

The post Developers of Altcoin Traded on Binance Reveal Reason for Major Price Drop – “Legal Process Has Begun” appeared on BitcoinEthereumNews.com. Private computing network Nillion explained that the sharp volatility seen in the NIL token price yesterday was caused by a market maker selling a large amount without authorization. The company stated that the party in question did not respond to any communication from the team during and after the sale. Nillion announced that it initiated a buyback process immediately following the incident, using funds from the treasury. It also stated that it had worked with exchanges to freeze accounts related to the sale and initiate legal action against the person or institution responsible. The company maintained that such unauthorized transactions occur from time to time in the crypto space, but that they would not remain passive this time. Nillion also announced that any funds recovered from the unauthorized token sales would be used for additional buybacks. NIL price has lost 36.3% of its value in the last 24 hours and is trading at $0.118 at the time of writing. Chart showing the decline in the price of NIL. NIL broke its all-time high price record at $0.95 about 8 months ago and is trading 87% lower than that record level at the time of writing. *This is not investment advice. Follow our Telegram and Twitter account now for exclusive news, analytics and on-chain data! Source: https://en.bitcoinsistemi.com/developers-of-altcoin-traded-on-binance-reveal-reason-for-major-price-drop-legal-process-has-begun/
Share
BitcoinEthereumNews2025/11/21 13:29
Crucial US Stock Market Update: What Wednesday’s Mixed Close Reveals

Crucial US Stock Market Update: What Wednesday’s Mixed Close Reveals

BitcoinWorld Crucial US Stock Market Update: What Wednesday’s Mixed Close Reveals The financial world often keeps us on our toes, and Wednesday was no exception. Investors watched closely as the US stock market concluded the day with a mixed performance across its major indexes. This snapshot offers a crucial glimpse into current investor sentiment and economic undercurrents, prompting many to ask: what exactly happened? Understanding the Latest US Stock Market Movements On Wednesday, the closing bell brought a varied picture for the US stock market. While some indexes celebrated gains, others registered slight declines, creating a truly mixed bag for investors. The Dow Jones Industrial Average showed resilience, climbing by a notable 0.57%. This positive movement suggests strength in some of the larger, more established companies. Conversely, the S&P 500, a broader benchmark often seen as a barometer for the overall market, experienced a modest dip of 0.1%. The technology-heavy Nasdaq Composite also saw a slight retreat, sliding by 0.33%. This particular index often reflects investor sentiment towards growth stocks and the tech sector. These divergent outcomes highlight the complex dynamics currently at play within the American economy. It’s not simply a matter of “up” or “down” for the entire US stock market; rather, it’s a nuanced landscape where different sectors and company types are responding to unique pressures and opportunities. Why Did the US Stock Market See Mixed Results? When the US stock market delivers a mixed performance, it often points to a tug-of-war between various economic factors. Several elements could have contributed to Wednesday’s varied closings. For instance, positive corporate earnings reports from certain industries might have bolstered the Dow. At the same time, concerns over inflation, interest rate policies by the Federal Reserve, or even global economic uncertainties could have pressured growth stocks, affecting the S&P 500 and Nasdaq. Key considerations often include: Economic Data: Recent reports on employment, manufacturing, or consumer spending can sway market sentiment. Corporate Announcements: Strong or weak earnings forecasts from influential companies can significantly impact their respective sectors. Interest Rate Expectations: The prospect of higher or lower interest rates directly influences borrowing costs for businesses and consumer spending, affecting future profitability. Geopolitical Events: Global tensions or trade policies can introduce uncertainty, causing investors to become more cautious. Understanding these underlying drivers is crucial for anyone trying to make sense of daily market fluctuations in the US stock market. Navigating Volatility in the US Stock Market A mixed close, while not a dramatic downturn, serves as a reminder that market volatility is a constant companion for investors. For those involved in the US stock market, particularly individuals managing their portfolios, these days underscore the importance of a well-thought-out strategy. It’s important not to react impulsively to daily movements. Instead, consider these actionable insights: Diversification: Spreading investments across different sectors and asset classes can help mitigate risk when one area underperforms. Long-Term Perspective: Focusing on long-term financial goals rather than short-term gains can help weather daily market swings. Stay Informed: Keeping abreast of economic news and company fundamentals provides context for market behavior. Consult Experts: Financial advisors can offer personalized guidance based on individual risk tolerance and objectives. Even small movements in major indexes can signal shifts that require attention, guiding future investment decisions within the dynamic US stock market. What’s Next for the US Stock Market? Looking ahead, investors will be keenly watching for further economic indicators and corporate announcements to gauge the direction of the US stock market. Upcoming inflation data, statements from the Federal Reserve, and quarterly earnings reports will likely provide more clarity. The interplay of these factors will continue to shape investor confidence and, consequently, the performance of the Dow, S&P 500, and Nasdaq. Remaining informed and adaptive will be key to understanding the market’s trajectory. Conclusion: Wednesday’s mixed close in the US stock market highlights the intricate balance of forces influencing financial markets. While the Dow showed strength, the S&P 500 and Nasdaq experienced slight declines, reflecting a nuanced economic landscape. This reminds us that understanding the ‘why’ behind these movements is as important as the movements themselves. As always, a thoughtful, informed approach remains the best strategy for navigating the complexities of the market. Frequently Asked Questions (FAQs) Q1: What does a “mixed close” mean for the US stock market? A1: A mixed close indicates that while some major stock indexes advanced, others declined. It suggests that different sectors or types of companies within the US stock market are experiencing varying influences, rather than a uniform market movement. Q2: Which major indexes were affected on Wednesday? A2: On Wednesday, the Dow Jones Industrial Average gained 0.57%, while the S&P 500 edged down 0.1%, and the Nasdaq Composite slid 0.33%, illustrating the mixed performance across the US stock market. Q3: What factors contribute to a mixed stock market performance? A3: Mixed performances in the US stock market can be influenced by various factors, including specific corporate earnings, economic data releases, shifts in interest rate expectations, and broader geopolitical events that affect different market segments uniquely. Q4: How should investors react to mixed market signals? A4: Investors are generally advised to maintain a long-term perspective, diversify their portfolios, stay informed about economic news, and avoid impulsive decisions. Consulting a financial advisor can also provide personalized guidance for navigating the US stock market. Q5: What indicators should investors watch for future US stock market trends? A5: Key indicators to watch include upcoming inflation reports, statements from the Federal Reserve regarding monetary policy, and quarterly corporate earnings reports. These will offer insights into the future direction of the US stock market. Did you find this analysis of the US stock market helpful? Share this article with your network on social media to help others understand the nuances of current financial trends! To learn more about the latest stock market trends, explore our article on key developments shaping the US stock market‘s future performance. This post Crucial US Stock Market Update: What Wednesday’s Mixed Close Reveals first appeared on BitcoinWorld.
Share
Coinstats2025/09/18 05:30