TLDR Ethereum’s daily active addresses hit a record ~2 million in February 2026, double the 2021 bull market peak Smart contract calls surpassed 40 million dailyTLDR Ethereum’s daily active addresses hit a record ~2 million in February 2026, double the 2021 bull market peak Smart contract calls surpassed 40 million daily

Ethereum (ETH) Price: Capital Outflows Hit ETH Despite Record Network Activity

2026/03/12 14:54
3 min read
For feedback or concerns regarding this content, please contact us at crypto.news@mexc.com

TLDR

  • Ethereum’s daily active addresses hit a record ~2 million in February 2026, double the 2021 bull market peak
  • Smart contract calls surpassed 40 million daily, also a record high
  • Despite record network growth, ETH has lost over 50% of its value in four months
  • Capital is flowing out of ETH — realized capitalization has turned negative
  • ETH is currently trading around $2,020–$2,055, with $2,080 as the key resistance to watch

Ethereum’s network is busier than ever. But the price tells a different story.

Ethereum (ETH) PriceEthereum (ETH) Price

Over the past few months, key activity metrics on the Ethereum blockchain have hit all-time highs. Daily active addresses reached around 2 million in February — double the peak seen during the 2021 bull run, according to data from CryptoQuant.

Smart contract calls have also surged past previous records. Total contract calls are now exceeding 40 million per day, well above levels seen in the 2021 and 2018 bull markets.

In past cycles, this kind of network growth usually came alongside price gains. Not this time.

ETH has dropped more than 50% over the past four months. Analysts at CryptoQuant say the link between network activity and price is breaking down.

Capital Is Leaving ETH

The bigger story may be where the money is going. ETH has seen larger exchange inflows than Bitcoin recently — a sign of higher selling pressure. Historically, that pattern has lined up with price tops.

Ethereum’s realized capitalization — a measure of net capital moving in and out — has also turned negative. That means more money is leaving the network than entering it.

Source; CryptoQuant

In 2021, a rising realized cap lined up with ETH’s biggest price gains. When it turned negative in 2022, prices fell sharply. The same pattern is playing out now.

Where ETH Stands Right Now

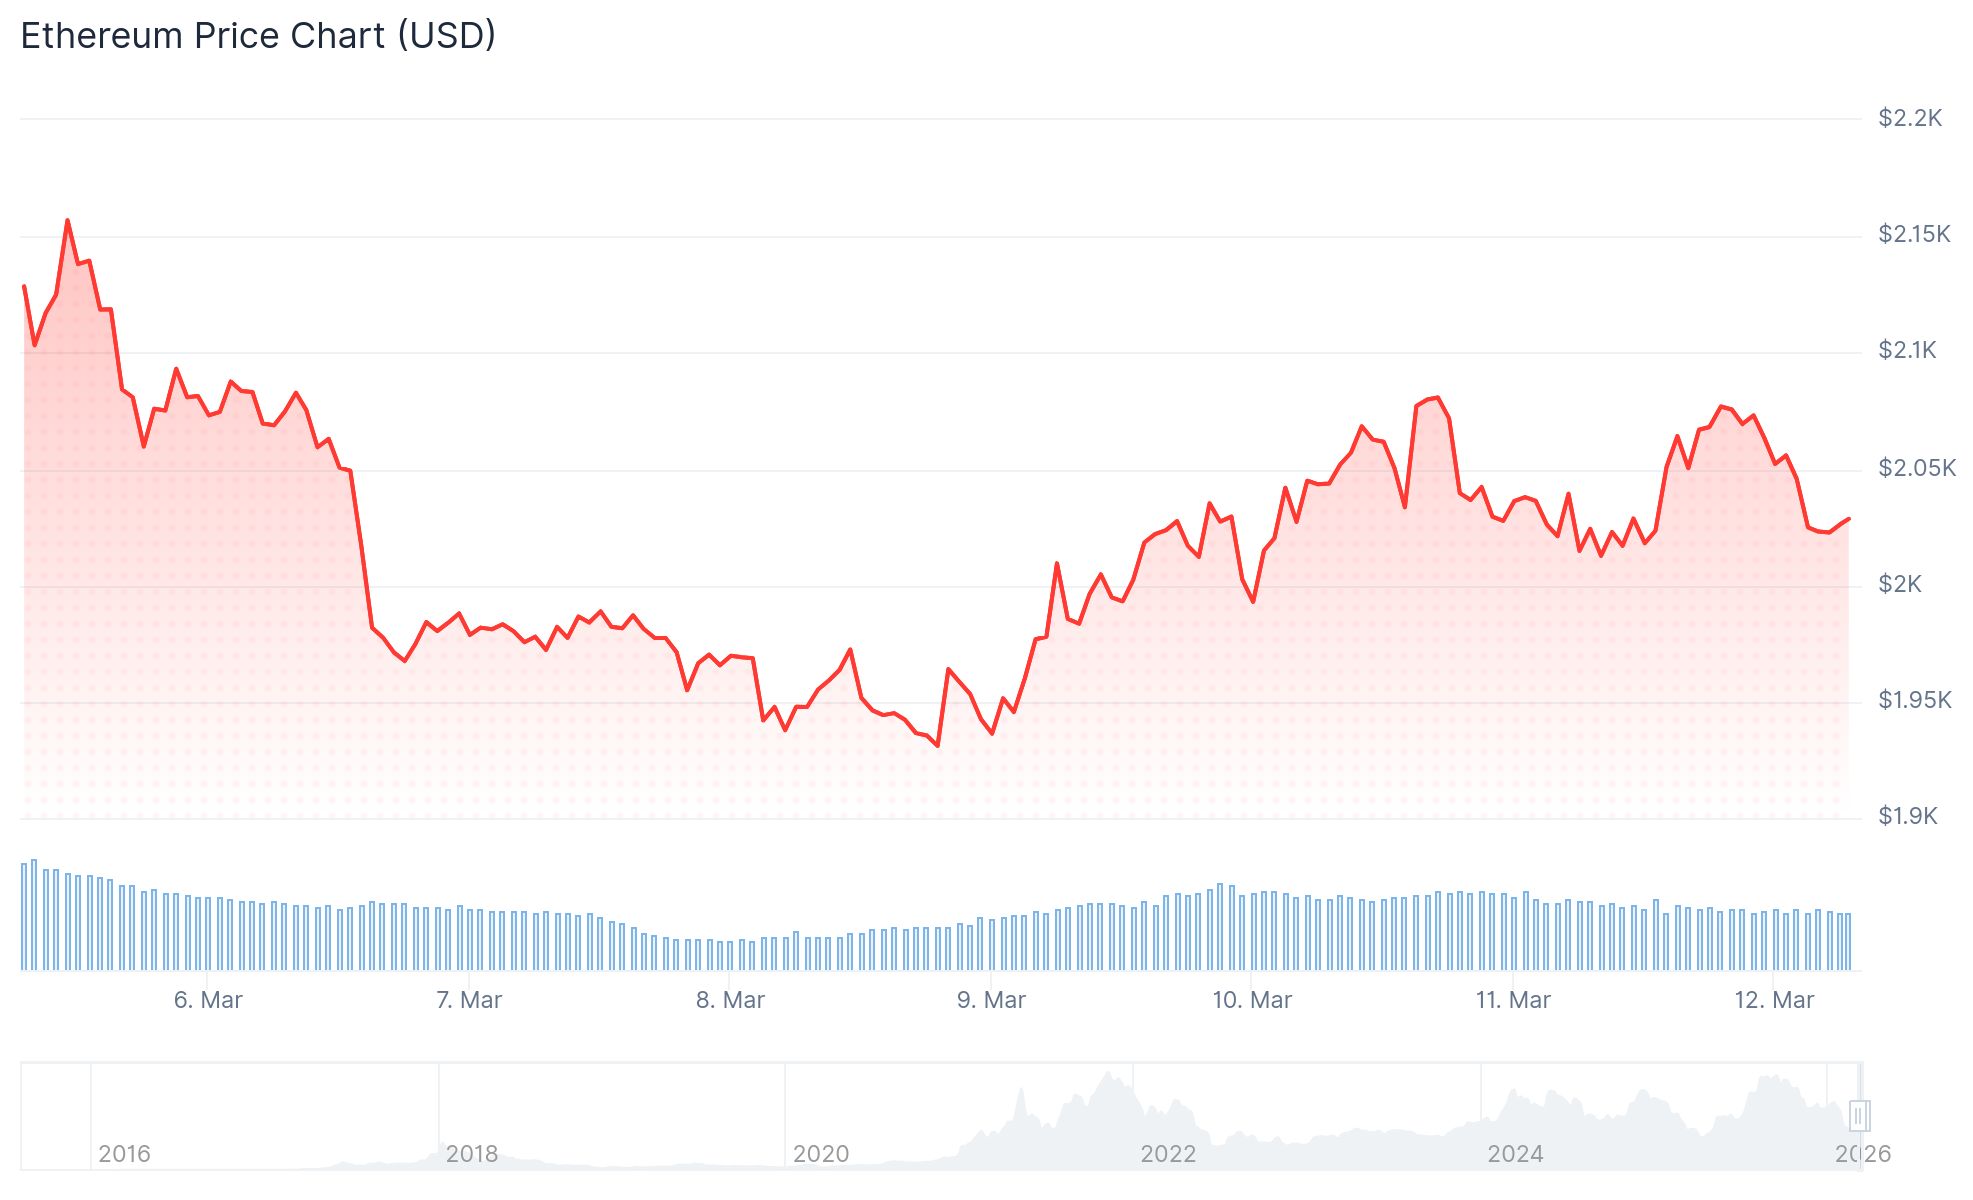
Ethereum is currently trading around $2,020–$2,055. The price cleared the $2,000 level after recovering from a low of $1,912, but is now facing resistance near $2,080.

The 20-day EMA sits near $2,024, and ETH is holding just above it. That’s seen as an important level for short-term direction.

The 50-day EMA is higher at around $2,219, suggesting the medium-term trend is still down.

If ETH can break above $2,080–$2,135, the next targets are $2,200 and potentially $2,389. On the downside, $1,980 is the first level to watch, followed by $1,910.

There were $43.3 million in liquidations over the last 24 hours — $24.6 million of which were short liquidations, according to Coinglass.

ETH is holding the $2,000 level for now. Traders are watching $2,080 as the next key test.

The post Ethereum (ETH) Price: Capital Outflows Hit ETH Despite Record Network Activity appeared first on CoinCentral.

Market Opportunity
Ethereum Logo
Ethereum Price(ETH)
$2,070.02
$2,070.02$2,070.02
+1.00%
USD
Ethereum (ETH) Live Price Chart
Disclaimer: The articles reposted on this site are sourced from public platforms and are provided for informational purposes only. They do not necessarily reflect the views of MEXC. All rights remain with the original authors. If you believe any content infringes on third-party rights, please contact crypto.news@mexc.com for removal. MEXC makes no guarantees regarding the accuracy, completeness, or timeliness of the content and is not responsible for any actions taken based on the information provided. The content does not constitute financial, legal, or other professional advice, nor should it be considered a recommendation or endorsement by MEXC.

You May Also Like

UNI Price Prediction: Testing $4.17 Upper Band Resistance, Targets $4.50 by April 2026

UNI Price Prediction: Testing $4.17 Upper Band Resistance, Targets $4.50 by April 2026

Uniswap trades at $3.88 with neutral RSI at 51.98. Technical analysis suggests potential breakout to $4.17 upper Bollinger Band, with bullish targets reaching $
Share
BlockChain News2026/03/12 17:21
Speed, Cost, and Intelligence: How Kie.ai’s Gemini 3 Flash API Balances Performance and Budget for Developers

Speed, Cost, and Intelligence: How Kie.ai’s Gemini 3 Flash API Balances Performance and Budget for Developers

Integrating AI into applications is a balancing act between performance, cost, and intelligence. Traditionally, high-performance AI models come with steep costs
Share
Techbullion2026/03/12 16:55
Cash Flow Valuation HyperLiquid: Could $HYPE Reach $385 in Five Years?

Cash Flow Valuation HyperLiquid: Could $HYPE Reach $385 in Five Years?

Author: G3ronimo Compiled by: TechFlow HyperLiquid has grown into a mature crypto-native exchange, with the majority of its net fees programmatically distributed directly to token holders through an "Assistance Fund" (AF). This design makes $HYPE one of the few tokens capable of being valued based on cash flow. To date, most valuations of HyperLiquid have relied on traditional multiples, comparing it to established financial platforms like Coinbase and Robinhood, using EBITDA or revenue multiples as a reference. Unlike traditional corporate stocks, where management typically retains and reinvests earnings at their discretion, HyperLiquid systematically returns 93% of transaction fees directly to token holders through a support fund. This model creates predictable and quantifiable cash flows, making it well-suited for detailed discounted cash flow (DCF) analysis rather than static multiple comparisons. Our methodology begins by determining $HYPE's cost of capital. We then invert the current market price to determine the market-implied future earnings. Finally, we apply growth projections to these earnings streams and compare the resulting intrinsic value to today's market price, revealing the valuation gap between current pricing and fundamental value. Why choose discounted cash flow (DCF) over a multiple? While other valuation methods compare HyperLiquid to Coinbase and Robinhood via EBITDA multiples, these methods have the following limitations: The difference between the corporate and token structures: Coinbase and Robinhood are corporate stocks, whose capital allocation is guided by the board of directors, and profits are retained and reinvested by management; while HyperLiquid systematically returns 93% of trading fees directly to token holders through a relief fund. Direct Cash Flow: HyperLiquid's design generates predictable cash flows that are well-suited to DCF models, rather than static multiples. Growth and risk characteristics: DCFs are able to explicitly model different growth scenarios and risk adjustments, whereas multiples may not adequately capture growth and risk dynamics. Determining an appropriate discount rate To determine our cost of equity, we start with reference data from the public market and adjust for cryptocurrency-specific risks: Cost of equity (r) ≈ Risk-free rate + β × Market risk premium + Crypto/illiquidity premium Beta Analysis Based on regression analysis with the S&P 500: Robinhood (HOOD): Beta of 2.5, implied cost of equity of 15.6%; Coinbase (COIN): Beta of 2.0, implied cost of equity of 13.6%; HyperLiquid (HYPE): Beta is 1.38 and the implied cost of equity is 10.5%. At first glance, $HYPE appears to have a lower beta, and therefore a lower cost of equity than Robinhood and Coinbase. However, the R² value reveals an important limitation: HOOD: The S&P 500 explains 50% of its returns; COIN: The S&P 500 explains 34% of its return; HYPE: The S&P 500 only explains 5% of its returns. $HYPE’s low R² suggests that traditional stock market factors are insufficient to explain its price fluctuations, and crypto-native risk factors need to be considered. risk assessment Despite $HYPE’s lower beta, we still adjust its discount rate from 10.5% to 13% (which is more conservative compared to COIN’s 13.6% and HOOD’s 15.6%) for the following reasons: Lower governance risk: Direct programmatic distribution of 93% of fees reduces concerns about corporate governance. In contrast, COIN and HOOD do not return any earnings to shareholders, and their capital allocation is determined by management. Higher Market Risk: $HYPE is a crypto-native asset and is subject to additional regulatory and technological uncertainties. Liquidity considerations: Token markets are generally less liquid than established stock markets. Get the Market Implied Price (MIP) Using our 13% discount rate, we can reverse engineer the market’s implied earnings expectations at the current $HYPE token price of approximately $54: Current market expectations: 2025: Total revenue of $700 million 2026: Total revenue of $1.4 billion Terminal growth: 3% annual growth thereafter These assumptions yield an intrinsic value of approximately $54, which is consistent with current market prices. This suggests that the market is pricing in modest growth based on current fee levels. At this point we need to ask a question: Does the market-implied price (MIP) reflect future cash flows? Alternative growth scenarios @Keisan_Crypto presents an attractive 2-year and 5-year bull market scenario. Original tweet link: Click here Two-year bull market forecast According to @Keisan_Crypto’s analysis, if HyperLiquid achieves the following goals: Annualized fees: $3.6 billion Aid fund income: $3.35 billion (93% of fees) Result: HYPE's intrinsic value is $128 (140% undervalued at current price) Related links Five-year bull market scenario Under a five-year bull market scenario (link), he predicts that transaction fees will reach $10 billion annually, with $9.3 billion accruing to $HYPE. He assumes HyperLiquid's global market share will grow from its current 5% to 50% by 2030. Even if it doesn't reach 50% market share, these figures are still achievable with a smaller market share as global trading volumes continue to grow. Five-year bull market forecast Annualized fees: $10 billion Aid fund income: $9.3 billion Result: HYPE's intrinsic value is $385 (600% undervalued at current price) Related links While this valuation is lower than Keisan's $1,000 target, the difference stems from our assumption of normalized earnings growth at 3% annually thereafter, while Keisan's model uses a cash flow multiple. We believe using cash flow multiples to project long-term value is problematic, as market multiples are volatile and can vary significantly over time. Furthermore, the multiples themselves incorporate earnings growth assumptions, while using the same cash flow multiple five years from now as one or two years later implies that growth levels from 2030 onward will be consistent with those in 2026/2027. Therefore, the multiples are more appropriate for short-term asset pricing. However, regardless of which model is used, $HYPE remains undervalued; this is a subtle difference. Additional Value Driver: USDH Under the Native Market model, USDH will use 50% of its stablecoin revenue for buybacks similar to a bailout fund. As a result, $HYPE can increase its free cash flow by $100 million (50% of $200 million) annually. Looking ahead five years, if USDH's market capitalization reaches $25 billion (currently still one-third of USDC's, and an even smaller portion of the total stablecoin market five years from now), its annual revenue could reach $1 billion. Following the same 50% distribution model, this would generate an additional $500 million in free cash flow per year for the aid fund. This would value each token at over $400. Excluding Value Drivers: HIP-3 and HyperEVM This DCF analysis intentionally excludes two important potential value drivers that are not amenable to cash flow modeling. Clearly, these would provide additional incremental value and could therefore be evaluated separately using different valuation methodologies and then added to this valuation. Summarize Our DCF analysis indicates that if HyperLiquid can maintain its growth trajectory and market position, the $HYPE token is significantly undervalued. The token's unique feature of programmatic fee distribution makes it particularly suitable for cash flow-based valuation methodologies. Methodological Notes This analysis builds on research by @Keisan_Crypto and @GLC_Research. The DCF model is open source and can be modified at the following link: https://valypto.xyz/project/hyperliquid/oNQraQIg Market data and forecasts are subject to change, and models should be updated promptly based on the latest information.
Share
PANews2025/09/19 08:00