Decentralized exchanges (DEXs) continue to reshape cryptocurrency trading, experiencing significant growth in trading volume, total value locked (TVL), and institutional interest. Key examples include Uniswap's launch of its v4 upgrade and "hooks" mechanism, which reduced gas fees and increased user flexibility, and PancakeSwap's record monthly trading volume in June 2025. These developments signal the deep maturity of the DeFi sector. Core Data Summary In the second quarter of 2025, the global DeFi protocol TVL reached US$123.6 billion, a year-on-year increase of 41%. Ethereum maintains its dominance, accounting for approximately 63% of the total TVL of DeFi protocols (approximately US$78.1 billion) by mid-2025. PancakeSwap's trading volume in June 2025 reached US$325 billion, setting a record for the highest single-month volume. As of mid-2025, Uniswap’s TVL across all supported chains is approximately $4.5 billion. As of the second quarter of 2025, the total market capitalization of the top 100 DeFi tokens was approximately $98.4 billion. PancakeSwap recorded 7.4 million unique users in the second quarter of 2025. 1. DEX Dynamics Uniswap launched v4 in early 2025, introducing a hook mechanism, singleton design, and gas optimization. By directly supporting ETH and reducing reliance on WETH, v4 reduced gas costs and improved transaction efficiency. Within approximately 177 days of its launch, the platform's TVL reached $1 billion, growing faster than v3 during the same period. PancakeSwap's trading volume reached $325 billion in June 2025, nearly double the data in May, setting a new monthly record. Thanks to low fees (approximately $0.0025 per transaction) and fast block times (approximately 400 milliseconds), Solana developer activity reportedly increased 200% year-over-year. Institutional funds (such as Franklin Templeton) are increasing their allocation to DeFi on chains like Solana. Large-scale cross-chain activity has increased, particularly represented by the growth of Arbitrum, BNB Chain, Optimism, and Base. 2. User Base and Adoption Trends By mid-2025, over 14.2 million unique wallets will interact with DeFi protocols. The average daily trading volume of some major DEXs fluctuates between $1 billion and $2 billion, depending on market volatility. DEX aggregators and routing volume are growing, with 1inch and Matcha routing over $3.9 billion weekly. The average weekly trading volume of DEXs in the second quarter of 2025 was US$18.6 billion, a year-on-year increase of approximately 33%. Among them, PancakeSwap had 7.4 million unique users in the second quarter of 2025. By mid-2025, over 9.7 million unique wallets will interact with decentralized exchanges (DEXs), up from approximately 6.8 million last year. Institutional interest (funds, ETFs) is growing, with a particular focus on scalable chains like Solana and Arbitrum. 3. Mainstream DEXs ranked by total locked value (TVL) By mid-2025 Uniswap's cross-chain TVL is approximately US$4.5 billion. PancakeSwap’s TVL is approximately $2.47 billion, most of which is located on the BNB Chain (approximately $2.18 billion). Lido leads the DeFi platform with approximately $30 billion in TVL, followed by Aave (approximately $15 billion) and Uniswap (approximately $10 billion). Curve Finance TVL is approximately US$2.1 billion. JustLend’s TVL is approximately $3.7 billion. Convex Finance reports a TVL of approximately $1.7 billion. 4. Mainstream trading pairs on DEX The BTC/USDT trading pair remains at the top of most DEXs. ETH/USDC and ETH/USDT continue to rank among the top three in terms of trading volume on Ethereum DEXs. On Solana DEXs such as Orca, SOL/USDC and SOL/USDT lead daily trading volume, with SOL-related trading pairs dominating. On Uniswap V4, high-liquidity pools primarily focus on stablecoin swaps and ETH/stablecoin pairs. The BNB/USDT trading pair is popular on BNB Chain and multi-chain DEXs, connecting to the BNB ecosystem token. On chain-agnostic aggregators, cross-chain/multi-hop transaction pairs involving USDT, USDC, or ETH frequently appear. On derivatives DEXs such as dYdX, BTC perpetual contracts against USD stablecoins and ETH perpetual contracts against USD are still mainstream trading pairs. 5. Fee structure and cost comparison Most DEX standard pool exchange fees range from 0.20% to 0.30%. Some stablecoin pools have lower fees, typically around 0.02% to 0.05%. Most of the exchange fees go to liquidity providers, and a small portion goes into the protocol treasury. Some emerging DEXs are experimenting with 0% maker fees or subsidized fees to attract liquidity. On derivatives platforms like dYdX, maker and taker fees are typically at a low basis point level. Gas and network fees remain a significant cost for many users. Aggregators sometimes reduce effective costs by routing transactions to cheaper pools. Some DEXs adopt a flexible fee model, with higher fees for volatile trading pairs and lower fees for stablecoin pairs. 6. DEX platform data by blockchain Ethereum: The TVL of DeFi protocols is approximately US$78.1 billion, accounting for approximately 63% of the total TVL of DeFi. Arbitrum: TVL is approximately US$10.4 billion, an increase of approximately 70% year-on-year. Optimism: TVL is approximately US$5.6 billion, more than doubling from approximately US$2.3 billion in 2024. BNB Chain: TVL grew modestly to approximately $7.9 billion. Base: TVL of approximately $2.2 billion, growing continuously since launch. Solana: Strong DEX activity, including high trading volume, high DEX usage share, and technical appeal (low fees, fast block times). Trading volume distribution: Approximately 67.5% of Uniswap’s daily trading volume now occurs on the second-layer network. PancakeSwap: Dominates the BNB Chain, but its TVL composition also supports cross-chain activities. Liquidity staking protocols: Although not strictly a DEX, they account for a significant portion of the TVL on chains like Ethereum. 7. Liquidity Depth and Slippage Rate Stablecoin pools and major asset pairs have deeper liquidity. For tokens with higher volatility or lower liquidity, slippage can be significant, ranging from 0.3% to over 1%. Pooled liquidity models reduce slippage by concentrating liquidity in active price zones. Smart routing and aggregator tools reduce slippage by splitting trades across multiple pools. In fast-moving markets, slippage can easily spike due to shallow liquidity and MEV activity. Average daily slippage for large trades on major DEXs has decreased compared to previous years. Many high-liquidity pools offer extremely tight spreads, often just a few basis points. The effective costs for traders include slippage, gas fees, routing fees, and exchange fees. 8. Cross-chain and multi-chain DEX activities In 2025, DEX trading volume will increase by approximately 37%, with an average monthly trading volume of approximately US$412 billion. Ethereum-based DEXs account for approximately 87% of decentralized trading volume. Solana DEX processes over $1.5 billion in daily trading volume, demonstrating strong competitiveness. Chains such as BNB Chain, Polygon, Base, Arbitrum, and Optimism are growing in importance. Cross-chain DEXs and bridges are increasingly used for arbitrage and liquidity migration, while aggregators supporting multiple chains are seeing increased usage as users seek the best rates. Liquidity fragmentation remains a challenge. Some multi-chain DEXs have introduced incentives to attract liquidity to less-used chains. 9. Key data of the decentralized storage market The global decentralized storage market size was US$622.9 million in 2024 and is expected to reach US$4.5 billion in 2034. The market is projected to expand at a robust compound annual growth rate (CAGR) of 22.4% from 2025 to 2034. The public cloud segment alone is projected to exceed $2 billion by 2034. The enterprise segment will account for 45% of the market share in 2024, reflecting strong institutional adoption. North America will account for 40% of the market share in 2024 and is the leading region in decentralized storage adoption. 10. Aggregators and Routing Volume Weekly volume routed through aggregators like 1inch and Matcha exceeds $3.9 billion. The 30-day average trading volume on 1inch is approximately $8.6 billion. Market share among Ethereum DEX aggregators is becoming increasingly concentrated. Aggregators act as middleware, becoming the gateway for institutional funds, improving execution through gas optimization, MEV protection, and cross-chain routing. Some aggregators are building KYC and compliance features to attract institutions. Aggregate routing often spans multiple chains, increasing bridging risk and complexity. 11. Smart Contract Audits and Security Incidents In the first quarter of 2025, Web3 lost over $2 billion due to vulnerabilities and attacks. In August 2025, 16 security incidents resulted in the theft of a total of $163 million. Cetus DEX was hacked in May 2025, resulting in losses of approximately $223-260 million. New Gold Protocol lost $2 million due to a flash loan vulnerability. Nemo Protocol on Sui suffered an approximately $2.6 million exploit. Approximately 80% of total cryptoasset losses originate from DeFi protocols. While formal verification and auditing can mitigate these losses, adoption remains mixed. Vulnerabilities caused by unaudited code and logic flaws continue to exist, hitting small DEXs the hardest. 12. Trading volume market share → Uniswap dominates the DEX market with a 55% share and is the absolute leader in trading volume. →PancakeSwap accounts for 20%, firmly ranking second among decentralized exchanges. →Curve accounts for 15%, performing strongly in liquidity provision and stablecoin swaps. → Other DEXs together account for 10%, constituting a smaller but still competitive market segment. 13. Regulatory and Compliance Data The United States passed the GENIUS Act in July 2025 to establish a regulatory framework for stablecoin issuers. By 2025, 90% of centralized crypto exchanges in North America will be fully compliant with KYC requirements. The average compliance cost for crypto companies will increase by approximately 28% to $620,000 per year in 2025. Anti-money laundering (AML) and KYC protocols currently consume approximately 34% of compliance budgets. The U.S. Commodity Futures Trading Commission (CFTC) enforcement actions increased by approximately 59% year-over-year. 14. Growth of DEX derivatives and perpetual contracts In the second quarter of 2025, the trading volume of DEX perpetual futures reached US$898 billion. Hyperliquid recorded $653 billion in trading volume in the second quarter, accounting for approximately 73% of the market share. dYdX remains one of the top decentralized derivatives exchanges. The growth is driven by demand for leverage, speculation and hedging tools. Institutional traders are increasingly participating in the perpetual contract market. Risk and compliance concerns remain major obstacles. Cross-chain perpetual contract products are emerging, bringing with them both opportunities and risks. For several quarters, the growth rate of derivatives trading volume has exceeded that of spot DEX. 15. DEX User Demographics and Geographic Distribution By mid-2025, over 9.7 million unique wallets will interact with DEXs, up from approximately 6.8 million last year. Daily trading volume is concentrated in North America, Europe, and Asia. Among these, DEX adoption is growing faster in developing countries. Institutional users are concentrated in jurisdictions with clearer regulations. Gender distribution still skews male, but with a slight shift. Small transactions in Asia and Africa have higher adoption rates on low-fee chains. 16. Conclusion The DEX field shows obvious signs of maturity. Aggregators are not only tools for retail users but are increasingly becoming critical infrastructure for institutions. However, risks remain high, with vulnerability exploits, security lapses, and regulatory uncertainty posing a real threat. DEX derivatives and perpetual contract trading has exploded, mobile and wallet-based platforms have become more attractive, and global user adoption continues to grow. The key takeaways for traders and protocol developers are: Choose a DEX or aggregator that has undergone rigorous security audits Prioritize chains and tools that reduce fees and slippage As DEXs increasingly approach centralized alternatives in terms of trading volume, liquidity depth, and trust, the next few years will test which platforms can withstand the challenges of security, compliance, and usability.Decentralized exchanges (DEXs) continue to reshape cryptocurrency trading, experiencing significant growth in trading volume, total value locked (TVL), and institutional interest. Key examples include Uniswap's launch of its v4 upgrade and "hooks" mechanism, which reduced gas fees and increased user flexibility, and PancakeSwap's record monthly trading volume in June 2025. These developments signal the deep maturity of the DeFi sector. Core Data Summary In the second quarter of 2025, the global DeFi protocol TVL reached US$123.6 billion, a year-on-year increase of 41%. Ethereum maintains its dominance, accounting for approximately 63% of the total TVL of DeFi protocols (approximately US$78.1 billion) by mid-2025. PancakeSwap's trading volume in June 2025 reached US$325 billion, setting a record for the highest single-month volume. As of mid-2025, Uniswap’s TVL across all supported chains is approximately $4.5 billion. As of the second quarter of 2025, the total market capitalization of the top 100 DeFi tokens was approximately $98.4 billion. PancakeSwap recorded 7.4 million unique users in the second quarter of 2025. 1. DEX Dynamics Uniswap launched v4 in early 2025, introducing a hook mechanism, singleton design, and gas optimization. By directly supporting ETH and reducing reliance on WETH, v4 reduced gas costs and improved transaction efficiency. Within approximately 177 days of its launch, the platform's TVL reached $1 billion, growing faster than v3 during the same period. PancakeSwap's trading volume reached $325 billion in June 2025, nearly double the data in May, setting a new monthly record. Thanks to low fees (approximately $0.0025 per transaction) and fast block times (approximately 400 milliseconds), Solana developer activity reportedly increased 200% year-over-year. Institutional funds (such as Franklin Templeton) are increasing their allocation to DeFi on chains like Solana. Large-scale cross-chain activity has increased, particularly represented by the growth of Arbitrum, BNB Chain, Optimism, and Base. 2. User Base and Adoption Trends By mid-2025, over 14.2 million unique wallets will interact with DeFi protocols. The average daily trading volume of some major DEXs fluctuates between $1 billion and $2 billion, depending on market volatility. DEX aggregators and routing volume are growing, with 1inch and Matcha routing over $3.9 billion weekly. The average weekly trading volume of DEXs in the second quarter of 2025 was US$18.6 billion, a year-on-year increase of approximately 33%. Among them, PancakeSwap had 7.4 million unique users in the second quarter of 2025. By mid-2025, over 9.7 million unique wallets will interact with decentralized exchanges (DEXs), up from approximately 6.8 million last year. Institutional interest (funds, ETFs) is growing, with a particular focus on scalable chains like Solana and Arbitrum. 3. Mainstream DEXs ranked by total locked value (TVL) By mid-2025 Uniswap's cross-chain TVL is approximately US$4.5 billion. PancakeSwap’s TVL is approximately $2.47 billion, most of which is located on the BNB Chain (approximately $2.18 billion). Lido leads the DeFi platform with approximately $30 billion in TVL, followed by Aave (approximately $15 billion) and Uniswap (approximately $10 billion). Curve Finance TVL is approximately US$2.1 billion. JustLend’s TVL is approximately $3.7 billion. Convex Finance reports a TVL of approximately $1.7 billion. 4. Mainstream trading pairs on DEX The BTC/USDT trading pair remains at the top of most DEXs. ETH/USDC and ETH/USDT continue to rank among the top three in terms of trading volume on Ethereum DEXs. On Solana DEXs such as Orca, SOL/USDC and SOL/USDT lead daily trading volume, with SOL-related trading pairs dominating. On Uniswap V4, high-liquidity pools primarily focus on stablecoin swaps and ETH/stablecoin pairs. The BNB/USDT trading pair is popular on BNB Chain and multi-chain DEXs, connecting to the BNB ecosystem token. On chain-agnostic aggregators, cross-chain/multi-hop transaction pairs involving USDT, USDC, or ETH frequently appear. On derivatives DEXs such as dYdX, BTC perpetual contracts against USD stablecoins and ETH perpetual contracts against USD are still mainstream trading pairs. 5. Fee structure and cost comparison Most DEX standard pool exchange fees range from 0.20% to 0.30%. Some stablecoin pools have lower fees, typically around 0.02% to 0.05%. Most of the exchange fees go to liquidity providers, and a small portion goes into the protocol treasury. Some emerging DEXs are experimenting with 0% maker fees or subsidized fees to attract liquidity. On derivatives platforms like dYdX, maker and taker fees are typically at a low basis point level. Gas and network fees remain a significant cost for many users. Aggregators sometimes reduce effective costs by routing transactions to cheaper pools. Some DEXs adopt a flexible fee model, with higher fees for volatile trading pairs and lower fees for stablecoin pairs. 6. DEX platform data by blockchain Ethereum: The TVL of DeFi protocols is approximately US$78.1 billion, accounting for approximately 63% of the total TVL of DeFi. Arbitrum: TVL is approximately US$10.4 billion, an increase of approximately 70% year-on-year. Optimism: TVL is approximately US$5.6 billion, more than doubling from approximately US$2.3 billion in 2024. BNB Chain: TVL grew modestly to approximately $7.9 billion. Base: TVL of approximately $2.2 billion, growing continuously since launch. Solana: Strong DEX activity, including high trading volume, high DEX usage share, and technical appeal (low fees, fast block times). Trading volume distribution: Approximately 67.5% of Uniswap’s daily trading volume now occurs on the second-layer network. PancakeSwap: Dominates the BNB Chain, but its TVL composition also supports cross-chain activities. Liquidity staking protocols: Although not strictly a DEX, they account for a significant portion of the TVL on chains like Ethereum. 7. Liquidity Depth and Slippage Rate Stablecoin pools and major asset pairs have deeper liquidity. For tokens with higher volatility or lower liquidity, slippage can be significant, ranging from 0.3% to over 1%. Pooled liquidity models reduce slippage by concentrating liquidity in active price zones. Smart routing and aggregator tools reduce slippage by splitting trades across multiple pools. In fast-moving markets, slippage can easily spike due to shallow liquidity and MEV activity. Average daily slippage for large trades on major DEXs has decreased compared to previous years. Many high-liquidity pools offer extremely tight spreads, often just a few basis points. The effective costs for traders include slippage, gas fees, routing fees, and exchange fees. 8. Cross-chain and multi-chain DEX activities In 2025, DEX trading volume will increase by approximately 37%, with an average monthly trading volume of approximately US$412 billion. Ethereum-based DEXs account for approximately 87% of decentralized trading volume. Solana DEX processes over $1.5 billion in daily trading volume, demonstrating strong competitiveness. Chains such as BNB Chain, Polygon, Base, Arbitrum, and Optimism are growing in importance. Cross-chain DEXs and bridges are increasingly used for arbitrage and liquidity migration, while aggregators supporting multiple chains are seeing increased usage as users seek the best rates. Liquidity fragmentation remains a challenge. Some multi-chain DEXs have introduced incentives to attract liquidity to less-used chains. 9. Key data of the decentralized storage market The global decentralized storage market size was US$622.9 million in 2024 and is expected to reach US$4.5 billion in 2034. The market is projected to expand at a robust compound annual growth rate (CAGR) of 22.4% from 2025 to 2034. The public cloud segment alone is projected to exceed $2 billion by 2034. The enterprise segment will account for 45% of the market share in 2024, reflecting strong institutional adoption. North America will account for 40% of the market share in 2024 and is the leading region in decentralized storage adoption. 10. Aggregators and Routing Volume Weekly volume routed through aggregators like 1inch and Matcha exceeds $3.9 billion. The 30-day average trading volume on 1inch is approximately $8.6 billion. Market share among Ethereum DEX aggregators is becoming increasingly concentrated. Aggregators act as middleware, becoming the gateway for institutional funds, improving execution through gas optimization, MEV protection, and cross-chain routing. Some aggregators are building KYC and compliance features to attract institutions. Aggregate routing often spans multiple chains, increasing bridging risk and complexity. 11. Smart Contract Audits and Security Incidents In the first quarter of 2025, Web3 lost over $2 billion due to vulnerabilities and attacks. In August 2025, 16 security incidents resulted in the theft of a total of $163 million. Cetus DEX was hacked in May 2025, resulting in losses of approximately $223-260 million. New Gold Protocol lost $2 million due to a flash loan vulnerability. Nemo Protocol on Sui suffered an approximately $2.6 million exploit. Approximately 80% of total cryptoasset losses originate from DeFi protocols. While formal verification and auditing can mitigate these losses, adoption remains mixed. Vulnerabilities caused by unaudited code and logic flaws continue to exist, hitting small DEXs the hardest. 12. Trading volume market share → Uniswap dominates the DEX market with a 55% share and is the absolute leader in trading volume. →PancakeSwap accounts for 20%, firmly ranking second among decentralized exchanges. →Curve accounts for 15%, performing strongly in liquidity provision and stablecoin swaps. → Other DEXs together account for 10%, constituting a smaller but still competitive market segment. 13. Regulatory and Compliance Data The United States passed the GENIUS Act in July 2025 to establish a regulatory framework for stablecoin issuers. By 2025, 90% of centralized crypto exchanges in North America will be fully compliant with KYC requirements. The average compliance cost for crypto companies will increase by approximately 28% to $620,000 per year in 2025. Anti-money laundering (AML) and KYC protocols currently consume approximately 34% of compliance budgets. The U.S. Commodity Futures Trading Commission (CFTC) enforcement actions increased by approximately 59% year-over-year. 14. Growth of DEX derivatives and perpetual contracts In the second quarter of 2025, the trading volume of DEX perpetual futures reached US$898 billion. Hyperliquid recorded $653 billion in trading volume in the second quarter, accounting for approximately 73% of the market share. dYdX remains one of the top decentralized derivatives exchanges. The growth is driven by demand for leverage, speculation and hedging tools. Institutional traders are increasingly participating in the perpetual contract market. Risk and compliance concerns remain major obstacles. Cross-chain perpetual contract products are emerging, bringing with them both opportunities and risks. For several quarters, the growth rate of derivatives trading volume has exceeded that of spot DEX. 15. DEX User Demographics and Geographic Distribution By mid-2025, over 9.7 million unique wallets will interact with DEXs, up from approximately 6.8 million last year. Daily trading volume is concentrated in North America, Europe, and Asia. Among these, DEX adoption is growing faster in developing countries. Institutional users are concentrated in jurisdictions with clearer regulations. Gender distribution still skews male, but with a slight shift. Small transactions in Asia and Africa have higher adoption rates on low-fee chains. 16. Conclusion The DEX field shows obvious signs of maturity. Aggregators are not only tools for retail users but are increasingly becoming critical infrastructure for institutions. However, risks remain high, with vulnerability exploits, security lapses, and regulatory uncertainty posing a real threat. DEX derivatives and perpetual contract trading has exploded, mobile and wallet-based platforms have become more attractive, and global user adoption continues to grow. The key takeaways for traders and protocol developers are: Choose a DEX or aggregator that has undergone rigorous security audits Prioritize chains and tools that reduce fees and slippage As DEXs increasingly approach centralized alternatives in terms of trading volume, liquidity depth, and trust, the next few years will test which platforms can withstand the challenges of security, compliance, and usability.
Decoding the DEX landscape in 2025: Public chain landscape, liquidity dynamics, and institutional trends

2025/09/23 17:00

Decentralized exchanges (DEXs) continue to reshape cryptocurrency trading, experiencing significant growth in trading volume, total value locked (TVL), and institutional interest. Key examples include Uniswap's launch of its v4 upgrade and "hooks" mechanism, which reduced gas fees and increased user flexibility, and PancakeSwap's record monthly trading volume in June 2025. These developments signal the deep maturity of the DeFi sector.

Core Data Summary

  • In the second quarter of 2025, the global DeFi protocol TVL reached US$123.6 billion, a year-on-year increase of 41%.
  • Ethereum maintains its dominance, accounting for approximately 63% of the total TVL of DeFi protocols (approximately US$78.1 billion) by mid-2025.
  • PancakeSwap's trading volume in June 2025 reached US$325 billion, setting a record for the highest single-month volume.
  • As of mid-2025, Uniswap’s TVL across all supported chains is approximately $4.5 billion.
  • As of the second quarter of 2025, the total market capitalization of the top 100 DeFi tokens was approximately $98.4 billion.
  • PancakeSwap recorded 7.4 million unique users in the second quarter of 2025.

1. DEX Dynamics

Uniswap launched v4 in early 2025, introducing a hook mechanism, singleton design, and gas optimization. By directly supporting ETH and reducing reliance on WETH, v4 reduced gas costs and improved transaction efficiency. Within approximately 177 days of its launch, the platform's TVL reached $1 billion, growing faster than v3 during the same period.

PancakeSwap's trading volume reached $325 billion in June 2025, nearly double the data in May, setting a new monthly record.

Thanks to low fees (approximately $0.0025 per transaction) and fast block times (approximately 400 milliseconds), Solana developer activity reportedly increased 200% year-over-year. Institutional funds (such as Franklin Templeton) are increasing their allocation to DeFi on chains like Solana.

Large-scale cross-chain activity has increased, particularly represented by the growth of Arbitrum, BNB Chain, Optimism, and Base.

2. User Base and Adoption Trends

By mid-2025, over 14.2 million unique wallets will interact with DeFi protocols. The average daily trading volume of some major DEXs fluctuates between $1 billion and $2 billion, depending on market volatility. DEX aggregators and routing volume are growing, with 1inch and Matcha routing over $3.9 billion weekly.

The average weekly trading volume of DEXs in the second quarter of 2025 was US$18.6 billion, a year-on-year increase of approximately 33%. Among them, PancakeSwap had 7.4 million unique users in the second quarter of 2025.

By mid-2025, over 9.7 million unique wallets will interact with decentralized exchanges (DEXs), up from approximately 6.8 million last year. Institutional interest (funds, ETFs) is growing, with a particular focus on scalable chains like Solana and Arbitrum.

3. Mainstream DEXs ranked by total locked value (TVL)

By mid-2025

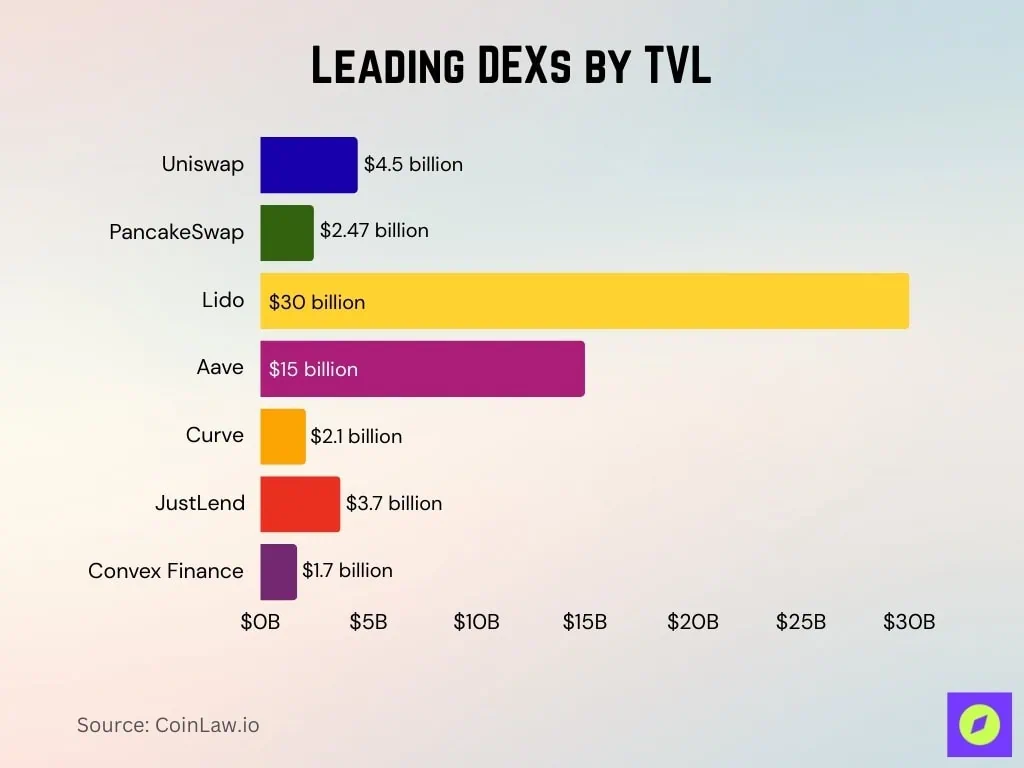
  • Uniswap's cross-chain TVL is approximately US$4.5 billion.
  • PancakeSwap’s TVL is approximately $2.47 billion, most of which is located on the BNB Chain (approximately $2.18 billion).
  • Lido leads the DeFi platform with approximately $30 billion in TVL, followed by Aave (approximately $15 billion) and Uniswap (approximately $10 billion).
  • Curve Finance TVL is approximately US$2.1 billion.
  • JustLend’s TVL is approximately $3.7 billion.
  • Convex Finance reports a TVL of approximately $1.7 billion.

4. Mainstream trading pairs on DEX

The BTC/USDT trading pair remains at the top of most DEXs. ETH/USDC and ETH/USDT continue to rank among the top three in terms of trading volume on Ethereum DEXs.

On Solana DEXs such as Orca, SOL/USDC and SOL/USDT lead daily trading volume, with SOL-related trading pairs dominating.

On Uniswap V4, high-liquidity pools primarily focus on stablecoin swaps and ETH/stablecoin pairs. The BNB/USDT trading pair is popular on BNB Chain and multi-chain DEXs, connecting to the BNB ecosystem token.

On chain-agnostic aggregators, cross-chain/multi-hop transaction pairs involving USDT, USDC, or ETH frequently appear.

On derivatives DEXs such as dYdX, BTC perpetual contracts against USD stablecoins and ETH perpetual contracts against USD are still mainstream trading pairs.

5. Fee structure and cost comparison

Most DEX standard pool exchange fees range from 0.20% to 0.30%. Some stablecoin pools have lower fees, typically around 0.02% to 0.05%.

Most of the exchange fees go to liquidity providers, and a small portion goes into the protocol treasury.

Some emerging DEXs are experimenting with 0% maker fees or subsidized fees to attract liquidity. On derivatives platforms like dYdX, maker and taker fees are typically at a low basis point level.

Gas and network fees remain a significant cost for many users. Aggregators sometimes reduce effective costs by routing transactions to cheaper pools.

Some DEXs adopt a flexible fee model, with higher fees for volatile trading pairs and lower fees for stablecoin pairs.

6. DEX platform data by blockchain

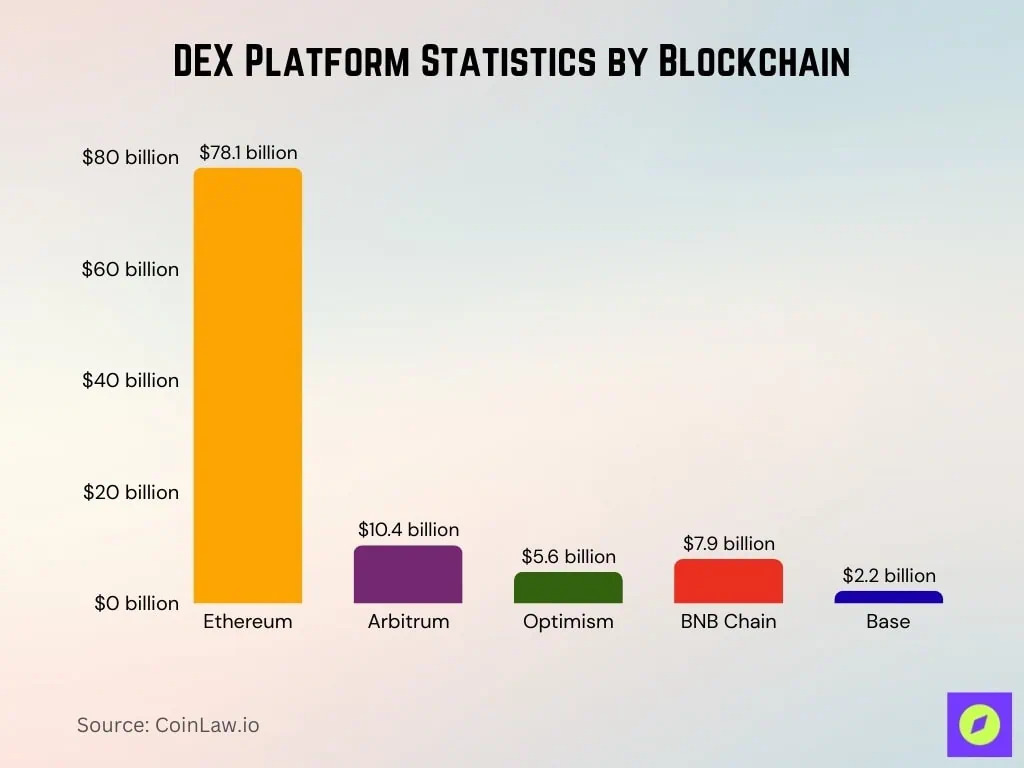
  • Ethereum: The TVL of DeFi protocols is approximately US$78.1 billion, accounting for approximately 63% of the total TVL of DeFi.
  • Arbitrum: TVL is approximately US$10.4 billion, an increase of approximately 70% year-on-year.
  • Optimism: TVL is approximately US$5.6 billion, more than doubling from approximately US$2.3 billion in 2024.
  • BNB Chain: TVL grew modestly to approximately $7.9 billion.
  • Base: TVL of approximately $2.2 billion, growing continuously since launch.

  • Solana: Strong DEX activity, including high trading volume, high DEX usage share, and technical appeal (low fees, fast block times).
  • Trading volume distribution: Approximately 67.5% of Uniswap’s daily trading volume now occurs on the second-layer network.
  • PancakeSwap: Dominates the BNB Chain, but its TVL composition also supports cross-chain activities.
  • Liquidity staking protocols: Although not strictly a DEX, they account for a significant portion of the TVL on chains like Ethereum.

7. Liquidity Depth and Slippage Rate

Stablecoin pools and major asset pairs have deeper liquidity. For tokens with higher volatility or lower liquidity, slippage can be significant, ranging from 0.3% to over 1%.

Pooled liquidity models reduce slippage by concentrating liquidity in active price zones. Smart routing and aggregator tools reduce slippage by splitting trades across multiple pools.

In fast-moving markets, slippage can easily spike due to shallow liquidity and MEV activity. Average daily slippage for large trades on major DEXs has decreased compared to previous years. Many high-liquidity pools offer extremely tight spreads, often just a few basis points.

The effective costs for traders include slippage, gas fees, routing fees, and exchange fees.

8. Cross-chain and multi-chain DEX activities

In 2025, DEX trading volume will increase by approximately 37%, with an average monthly trading volume of approximately US$412 billion.

Ethereum-based DEXs account for approximately 87% of decentralized trading volume. Solana DEX processes over $1.5 billion in daily trading volume, demonstrating strong competitiveness. Chains such as BNB Chain, Polygon, Base, Arbitrum, and Optimism are growing in importance.

Cross-chain DEXs and bridges are increasingly used for arbitrage and liquidity migration, while aggregators supporting multiple chains are seeing increased usage as users seek the best rates.

Liquidity fragmentation remains a challenge. Some multi-chain DEXs have introduced incentives to attract liquidity to less-used chains.

9. Key data of the decentralized storage market

The global decentralized storage market size was US$622.9 million in 2024 and is expected to reach US$4.5 billion in 2034.

The market is projected to expand at a robust compound annual growth rate (CAGR) of 22.4% from 2025 to 2034. The public cloud segment alone is projected to exceed $2 billion by 2034. The enterprise segment will account for 45% of the market share in 2024, reflecting strong institutional adoption.

North America will account for 40% of the market share in 2024 and is the leading region in decentralized storage adoption.

10. Aggregators and Routing Volume

Weekly volume routed through aggregators like 1inch and Matcha exceeds $3.9 billion. The 30-day average trading volume on 1inch is approximately $8.6 billion. Market share among Ethereum DEX aggregators is becoming increasingly concentrated.

Aggregators act as middleware, becoming the gateway for institutional funds, improving execution through gas optimization, MEV protection, and cross-chain routing. Some aggregators are building KYC and compliance features to attract institutions.

Aggregate routing often spans multiple chains, increasing bridging risk and complexity.

11. Smart Contract Audits and Security Incidents

In the first quarter of 2025, Web3 lost over $2 billion due to vulnerabilities and attacks. In August 2025, 16 security incidents resulted in the theft of a total of $163 million.

  • Cetus DEX was hacked in May 2025, resulting in losses of approximately $223-260 million.
  • New Gold Protocol lost $2 million due to a flash loan vulnerability.
  • Nemo Protocol on Sui suffered an approximately $2.6 million exploit.

Approximately 80% of total cryptoasset losses originate from DeFi protocols. While formal verification and auditing can mitigate these losses, adoption remains mixed.

Vulnerabilities caused by unaudited code and logic flaws continue to exist, hitting small DEXs the hardest.

12. Trading volume market share

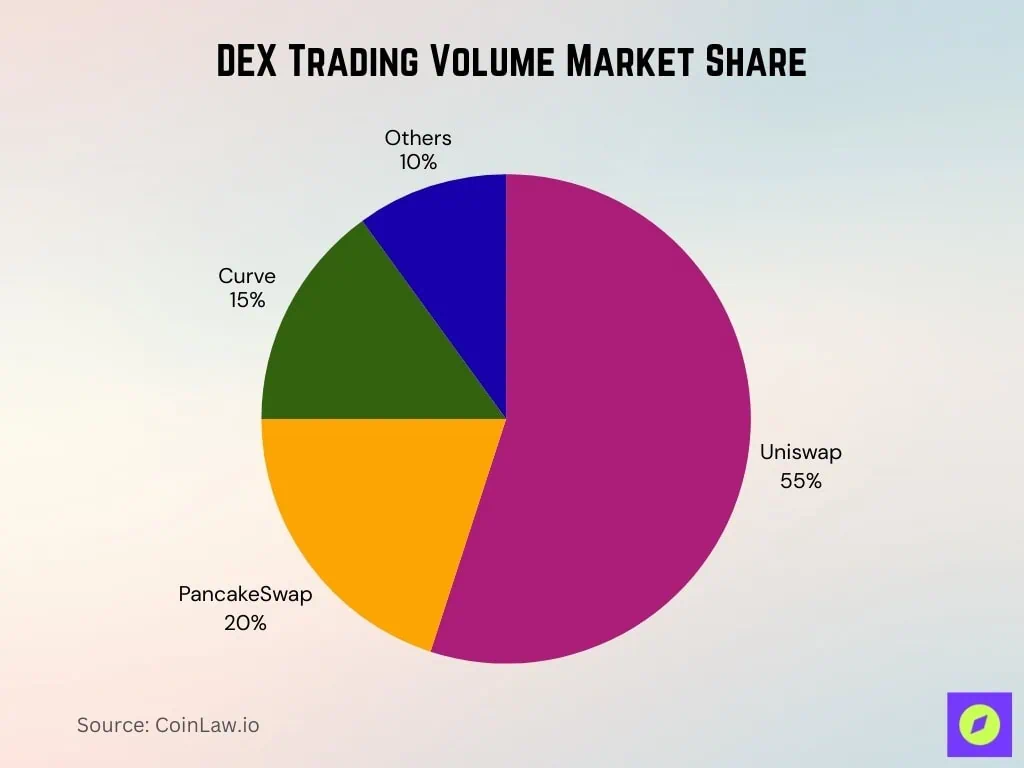
→ Uniswap dominates the DEX market with a 55% share and is the absolute leader in trading volume.

→PancakeSwap accounts for 20%, firmly ranking second among decentralized exchanges.

→Curve accounts for 15%, performing strongly in liquidity provision and stablecoin swaps.

→ Other DEXs together account for 10%, constituting a smaller but still competitive market segment.
13. Regulatory and Compliance Data

The United States passed the GENIUS Act in July 2025 to establish a regulatory framework for stablecoin issuers.

By 2025, 90% of centralized crypto exchanges in North America will be fully compliant with KYC requirements. The average compliance cost for crypto companies will increase by approximately 28% to $620,000 per year in 2025. Anti-money laundering (AML) and KYC protocols currently consume approximately 34% of compliance budgets.

The U.S. Commodity Futures Trading Commission (CFTC) enforcement actions increased by approximately 59% year-over-year.

14. Growth of DEX derivatives and perpetual contracts

In the second quarter of 2025, the trading volume of DEX perpetual futures reached US$898 billion.

Hyperliquid recorded $653 billion in trading volume in the second quarter, accounting for approximately 73% of the market share. dYdX remains one of the top decentralized derivatives exchanges.

  • The growth is driven by demand for leverage, speculation and hedging tools.
  • Institutional traders are increasingly participating in the perpetual contract market.
  • Risk and compliance concerns remain major obstacles.
  • Cross-chain perpetual contract products are emerging, bringing with them both opportunities and risks.
  • For several quarters, the growth rate of derivatives trading volume has exceeded that of spot DEX.

15. DEX User Demographics and Geographic Distribution

By mid-2025, over 9.7 million unique wallets will interact with DEXs, up from approximately 6.8 million last year.

Daily trading volume is concentrated in North America, Europe, and Asia. Among these, DEX adoption is growing faster in developing countries. Institutional users are concentrated in jurisdictions with clearer regulations. Gender distribution still skews male, but with a slight shift.

Small transactions in Asia and Africa have higher adoption rates on low-fee chains.

16. Conclusion

The DEX field shows obvious signs of maturity.

Aggregators are not only tools for retail users but are increasingly becoming critical infrastructure for institutions. However, risks remain high, with vulnerability exploits, security lapses, and regulatory uncertainty posing a real threat.

DEX derivatives and perpetual contract trading has exploded, mobile and wallet-based platforms have become more attractive, and global user adoption continues to grow.

The key takeaways for traders and protocol developers are:

  • Choose a DEX or aggregator that has undergone rigorous security audits
  • Prioritize chains and tools that reduce fees and slippage

As DEXs increasingly approach centralized alternatives in terms of trading volume, liquidity depth, and trust, the next few years will test which platforms can withstand the challenges of security, compliance, and usability.

Disclaimer: The articles reposted on this site are sourced from public platforms and are provided for informational purposes only. They do not necessarily reflect the views of MEXC. All rights remain with the original authors. If you believe any content infringes on third-party rights, please contact service@support.mexc.com for removal. MEXC makes no guarantees regarding the accuracy, completeness, or timeliness of the content and is not responsible for any actions taken based on the information provided. The content does not constitute financial, legal, or other professional advice, nor should it be considered a recommendation or endorsement by MEXC.
Share Insights

You May Also Like

Japan’s Iron Lady Sanae Takaichi May Reshape Crypto Policy

Japan’s Iron Lady Sanae Takaichi May Reshape Crypto Policy

On October 4, 2025, Sanae Takaichi was elected as the new leader of Japan’s Liberal Democratic Party. She is expected to be nominated as the country’s first female prime minister during the extraordinary Diet session on October 15. Known for her pro-growth and fiscally proactive approach, Takaichi’s economic policies prioritize ending deflation and promoting economic expansion. While she has not made explicit statements on cryptocurrency, her fiscal stance and potential cooperation with opposition parties could influence crypto taxation reforms, which the Japanese digital asset industry has long anticipated. Japan’s Iron Lady: Takaichi’s Profile Takaichi has long admired the late British Prime Minister Margaret Thatcher. Her admiration brings her closer to realizing ambitions linked to the “Iron Lady” persona. Born in 1961, Takaichi graduated from Kobe University’s Faculty of Business Administration, trained at the Matsushita Institute of Government and Management, and gained practical experience as a US Congressional Fellow. After working as a television broadcaster, she was first elected to the House of Representatives in 1993 and is currently serving her tenth term. As a politician, she has held key positions, including three terms as Minister of Internal Affairs and Communications and Economic Security Minister and special appointments at the Cabinet Office. She played a central role during the Abe administration, demonstrating economic and security policy influence. After being elected LDP leader, she stated, “I will have everyone work like carriage horses. I will abandon the concept of work-life balance,” emphasizing her determination. Contrasting Stances with Former Prime Minister Ishiba Takaichi’s approach to cryptocurrency and Web3 differs from that of former Prime Minister Ishiba. In August 2025, Ishiba expressed support for Web3 and blockchain technology at WebX2025, the country’s largest Web3 conference. However, when questioned about separate taxation for cryptocurrency in December 2024 during a Diet session, Ishiba showed a cautious stance, which disappointed some industry stakeholders. Although Ishiba spoke positively at public events, he remained reluctant to pursue concrete tax reforms. Takaichi has not made specific statements on cryptocurrency policy, but her proactive fiscal approach and tax-reduction orientation may indirectly support reforms in the sector. Opposition Cooperation and Potential Tax Reforms A key factor for potential cryptocurrency tax reform is Takaichi’s policy toward opposition parties. She has indicated intentions to strengthen cooperation with the Japan Innovation Party and the Democratic Party for the People, which have historically supported cryptocurrency tax reforms. The Democratic Party for the People has historically supported crypto tax reforms. Its leader, Yuichiro Tamaki, expressed disappointment with former Prime Minister Ishiba’s cautious stance. The Japan Innovation Party has also been positive toward deregulation and tax reform. If Takaichi strengthens cooperation with these oppositions, the likelihood of implementing cryptocurrency tax reforms as part of a broader tax reduction policy could increase. On August 29, 2025, the Financial Services Agency(FSA) formally requested a review of cryptocurrency taxation for FY2026. Proposed measures include: introducing separate taxation—aligning crypto gains with equities at approximately 20%, compared to the current progressive rate of up to 55%—and allowing loss carryforwards for up to three years. The government’s “New Capitalism Grand Design 2025 Revision” explicitly mentions considering separate taxation. If Takaichi deepens cooperation with opposition parties and prioritizes tax reductions, these reforms could be realized in the 2026 ordinary Diet session. Trump Visits Japan: Implications for Crypto Policy One of Takaichi’s first significant foreign policy challenges will be the scheduled visit of US President Donald Trump in late October. Trump is expected to visit Japan for three days starting around October 27. During this visit, he will hold his first summit with Takaichi. Since assuming office in January 2025, Trump has stated his intention to make the US a global center for crypto, implementing policies such as building Bitcoin strategic reserves and establishing a cryptocurrency advisory committee. Both leaders’ shared pro-growth perspectives may allow for economic policy coordination during the meeting. However, Takaichi’s conservative values may affect the degree to which she aligns with Trump’s crypto initiatives. Any discussions on Bitcoin reserves or crypto deregulation will be an essential indicator for Japan’s cryptocurrency industry. Uncertainties and Potential Impacts Significant uncertainties remain regarding Takaichi’s cryptocurrency policies. Her primary focus may remain on traditional industry policies and national security. Cabinet appointments are a key factor. Finance Minister Katsunobu Kato’s retention could maintain policy continuity. However, Kato had limited engagement on crypto issues under Ishiba, which could limit drastic changes. Digital Minister Masaki Taira has also not articulated specific positions on cryptocurrency or Web3. Takaichi’s proactive fiscal policy could have potential negative impacts. Aggressive government spending might accelerate inflation, prompting the Bank of Japan to tighten monetary policy, which could be a headwind for risk assets, including cryptocurrencies. Her conservative orientation could lead to stricter measures against money laundering and terrorist financing. Furthermore, her interest in semiconductors and traditional manufacturing may deprioritize cryptocurrency and Web3. Takaichi’s election as LDP leader represents a turning point for the cryptocurrency industry in Japan. Strengthened cooperation with opposition parties and her tax-reduction stance may create opportunities for long-sought reforms, such as separate taxation and loss carryforwards. However, her limited direct engagement with cryptocurrency, potential regulatory tightening, and fiscal policy risks also create uncertainties. Cabinet appointments, opposition coordination, and the outcome of the Trump summit in late October will be critical factors influencing the industry’s future.
Share
Coinstats2025/10/06 09:44
Share
Bitcoin mining company Cango mined about 616 bitcoins in September, bringing its total holdings to 5,810.

Bitcoin mining company Cango mined about 616 bitcoins in September, bringing its total holdings to 5,810.

PANews reported on October 6 that the crypto mining company Cango released its September production and mining update. This month, Cango mined a total of 616.6 bitcoins, bringing its total bitcoin holdings to 5,810.
Share
PANews2025/10/06 11:07
Share
The Next Bitcoin Story Of 2025

The Next Bitcoin Story Of 2025

The post The Next Bitcoin Story Of 2025 appeared on BitcoinEthereumNews.com. Crypto News 18 September 2025 | 07:39 Bitcoin’s rise from obscure concept to a global asset is the playbook every serious investor pores over, and it still isn’t done writing; Bitcoin now trades above $115,000, a reminder that the life-changing runs begin before most people are even looking. T The question hanging over this cycle is simple: can a new contender compress that arc, faster, cleaner, earlier, while the window is still open for those willing to move first? Coins still on presales are the ones can repeat this story, and among those coins, an Ethereum based meme coin catches most of the attention, as it’s team look determined to make an impact in today’s market, fusing culture with working tools, with a design built to reward early movers rather than late chasers. If you’re hunting the next asymmetric shot, this is where momentum and mechanics meet, which is why many traders quietly tag this exact meme coin as the best crypto to buy now in a crowded market. Before we dive deeper, take a quick rewind through the case study every crypto desk knows by heart: how Bitcoin went from about $0.0025 to above $100,000, and turned a niche experiment into the story that still sets the bar for everything that follows. Bitcoin 2010-2025 Price History Back to first principles: a strange internet money appears in 2010 and then, step by step, rewires the entire market, Bitcoin’s arc from about $0.0025 to above $100,000 is the case study every desk still cites because it proves one coin can move the entire game. In 2009 almost no one guessed the destination; launched on January 3, 2009, Bitcoin picked up a price signal in 2010 when the pizza trade valued BTC near $0,0025 while early exchange quotes lived at fractions of…
Share
BitcoinEthereumNews2025/09/18 12:41
Share