

Bitget Token (BGB) Price Prediction 2025, 2026-2030
- Bullish BGB price prediction for 2025 is $3.883 to $4.567.
- Bitget Token (BGB) price might reach $10 soon.
- Bearish (BGB) price prediction for 2025 is $2.883.
In this Bitget Token (BGB) price prediction 2025, 2026-2030, we will analyze the price patterns of BGB by using accurate trader-friendly technical analysis indicators and predict the future movement of the cryptocurrency.
|
TABLE OF CONTENTS
|
|
INTRODUCTION
|
|
|
Bitget Token (BGB) PRICE PREDICTION 2025
|
|
| Bitget Token (BGB) PRICE PREDICTION 2026, 2027-2030 |
| CONCLUSION |
| FAQ |
Bitget Token (BGB) Current Market Status
| Current Price | $3.61 |
| 24 – Hour Price Change | 0.66% Up |
| 24 – Hour Trading Volume | $57.6M |
| Market Cap | $2.51B |
| Circulating Supply | 696.85M BGB |
| All – Time High | $8.49 (On Dec 27, 2024) |
| All – Time Low | $0.05836 (On Aug 11, 2021) |
What is Bitget Token (BGB)
| TICKER | BGB |
| BLOCKCHAIN | Ethereum |
| CATEGORY | Exchange Token |
| ORIGIN DATE | July 2021 |
| UTILITIES | Governance,Transactions, gas fees & rewards |
Bitget Token (BGB) was launched in 2021 as the utility token for Bitget, one of the largest crypto exchanges. The token is utilized for governance, to facilitate transactions and as tokens for loyalty. The cryptocurrency recently hit a new all-time high on December 11 as the crypto market turned bullish.
Moreover, the Bitget exchange has been gaining popularity within the community. It has made several advancements in the past year. Recently, the exchange re-entered the UK markets after receiving approval from the FCA in November 2024.
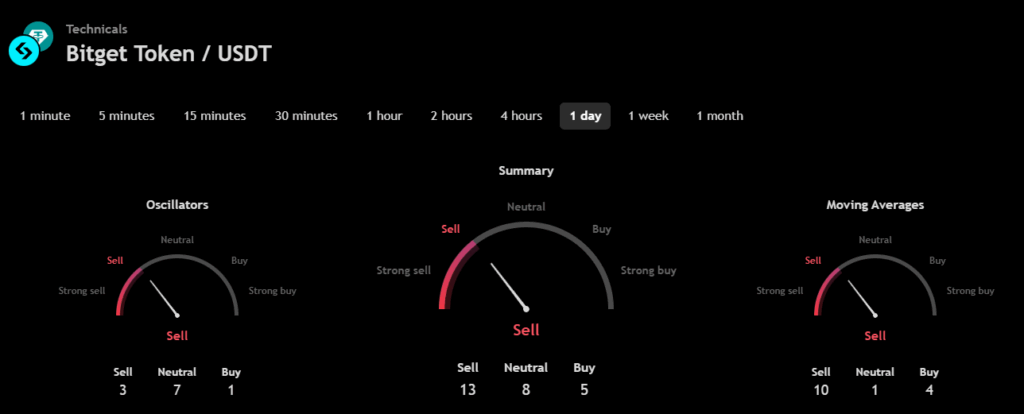
Bitget Token 24H Technicals
Bitget Token (BGB) Price Prediction 2025
Bitget Token (BGB) ranks 36th on CoinMarketCap in terms of its market capitalization. The overview of the Bitget Token price prediction for 2025 is explained below with a daily time frame.
In the above chart, Bitget Token (BGB) laid out a descending channel pattern. Descending channel patterns are short-term bearish in that a stock moves lower within a descending channel, but they often form longer-term uptrends as continuation patterns. Higher prices often follow the descending channel pattern. But only after an upside penetration of the upper trend line. A descending channel is drawn by connecting the lower highs and lower lows of a security’s price with parallel trendlines to show a downward trend.
A trader could make a selling bet within a descending channel when the security price reaches its resistance trendline. An ascending channel is the opposite of a descending channel. Both ascending and descending channels are primary channels followed by technical analysts.
At the time of analysis, the price of Bitget Token (BGB) was recorded at $3.61. If the pattern trend continues, then the price of BGB might reach the resistance levels of $3.699 and $5.774. If the trend reverses, then the price of BGB may fall to the support of $3.283.
Bitget Token (BGB) Resistance and Support Levels
The chart given below elucidates the possible resistance and support levels of Bitget Token (BGB) in 2025.
From the above chart, we can analyze and identify the following as resistance and support levels of Bitget Token (BGB) for 2025.
| Resistance Level 1 | $3.883 |
| Resistance Level 2 | $4.567 |
| Support Level 1 | $3.331 |
| Support Level 2 | $2.883 |
BGB Resistance & Support Levels
Bitget Token (BGB) Price Prediction 2025 — RVOL, MA, and RSI
The technical analysis indicators, such as Relative Volume (RVOL), Moving Average (MA), and Relative Strength Index (RSI) of Bitget Token (BGB), are shown in the chart below.
From the readings on the chart above, we can make the following inferences regarding the current Bitget Token (BGB) market in 2025.
| INDICATOR | PURPOSE | READING | INFERENCE |
| 50-Day Moving Average (50MA) | Nature of the current trend by comparing the average price over 50 days | 50 MA =$3.909Price = $3.620 (50MA < Price) | Bullish/Uptrend |
| Relative Strength Index (RSI) | Magnitude of price change;Analyzing oversold & overbought conditions | 45.592 <30 = Oversold50-70 = Neutral>70 = Overbought | Nearly Oversold |
| Relative Volume (RVOL) | Asset’s trading volume in relation to its recent average volumes | Below cutoff line | Weak volume |
Bitget Token (BGB) Price Prediction 2025 — ADX, RVI
In the below chart, we analyze the strength and volatility of Bitget Token (BGB) using the following technical analysis indicators — Average Directional Index (ADX) and Relative Volatility Index (RVI).
From the readings on the chart above, we can make the following inferences regarding the price momentum of Bitget Token (BGB).
| INDICATOR | PURPOSE | READING | INFERENCE |
| Average Directional Index (ADX) | Strength of the trend momentum | 52.338 | Strong Trend |
| Relative Volatility Index (RVI) | Volatility over a specific period | 46.68 <50 = Low >50 = High | Low Volatility |
Comparison of BGB with BTC, ETH
Let us now compare the price movements of Bitget Token (BGB) with those of Bitcoin (BTC) and Ethereum (ETH).
From the above chart, we can interpret that the price action of BGB is similar to that of BTC and ETH. That is, when the price of BTC and ETH increases or decreases, the price of BGB also increases or decreases, respectively.
Bitget Token (BGB) Price Prediction 2026, 2027 – 2030
With the help of the aforementioned technical analysis indicators and trend patterns, let us predict the price of Bitget Token (BGB) between 2026, 2027, 2028, 2029, and 2030.
| Year | Bullish Price | Bearish Price |
| Bitget Token (BGB) Price Prediction 2026 | $13 | $2 |
| Bitget Token (BGB) Price Prediction 2027 | $16 | $1.9 |
| Bitget Token (BGB) Price Prediction 2028 | $19 | $1.7 |
| Bitget Token (BGB) Price Prediction 2029 | $21 | $1.5 |
| Bitget Token (BGB) Price Prediction 2030 | $24 | $1.3 |
Conclusion
If Bitget Token (BGB) establishes itself as a good investment in 2025, this year would be favorable to the cryptocurrency. In conclusion, the bullish Bitget Token (BGB) price prediction for 2025 is $4.567. Comparatively, if unfavorable sentiment is triggered, the bearish Bitget Token (BGB) price prediction for 2025 is $2.883.
If the market momentum and investors’ sentiment positively elevate, then Bitget Token (BGB) might hit $10. Furthermore, with future upgrades and advancements in the Bitget ecosystem, BGB might surpass its current all-time high (ATH) of $8.49 and mark a new ATH.
FAQ
1. What is Bitget Token (BGB)?
Bitget Token (BGB) is the native utility token of Bitget, a crypto centralized exchange (CEX). The updated BGB token was launched in July 2021 with the aim of providing platform users with a form of payment within the ecosystem.
2. Where can you purchase Bitget Token (BGB)?
Bitget Token (BGB) can be purchased directly on the Bitget exchange. BGB is also available for trading on Bitfinex.
3. Will Bitget Token (BGB) reach a new ATH soon?
With the ongoing developments and upgrades within the Bitget exchange platform, BGB has a high possibility of reaching its ATH soon.
4. What is the current all-time high (ATH) of Bitget Token (BGB)?
On December 27 2024, Bitget Token (BGB) reached its new all-time high (ATH) of $8.49.
5. What is the lowest price of Bitget Token (BGB)?
According to CoinMarketCap, BGB hit its all-time low (ATL) of $0.05836 on Aug 11, 2021.
6. Will Bitget Token (BGB) reach $25?
If the bullish trend continues and if Bitget Token (BGB) retests its resistance levels, it will hit $25 soon.
7. What will be the Bitget Token (BGB) price by 2026?
Bitget Token (BGB) price is expected to reach $26 by 2026.
8. What will be the Bitget Token (BGB) price by 2027?
Bitget Token (BGB) price is expected to reach $27 by 2027.
9. What will be the Bitget Token (BGB) price by 2028?
Bitget Token (BGB) price is expected to reach $28 by 2028.
10. What will be the Bitget Token (BGB) price by 2029?
Bitget Token (BGB) price is expected to reach $29 by 2029.
Top Crypto Predictions
Sui (SUI) Price Prediction
Mubarak (MUBARAK) Price Prediction
XRP (XRP) Price Prediction
Disclaimer: The opinion expressed in this article is solely the author’s. It does not represent any investment advice. TheNewsCrypto team encourages all to do their own research before investing.
Ayrıca Şunları da Beğenebilirsiniz

Trump Cancels Tech, AI Trade Negotiations With The UK

Egrag Crypto: XRP Could be Around $6 or $7 by Mid-November Based on this Analysis
