

Zcash Buyers Pull $17 Million Off Exchanges as Price Pauses — What Comes Next?
The Zcash price has seen a sharp run this cycle, up over 700% in three months, followed by a healthy pause. After rallying strongly through the last week, the price is now pulling back, raising questions about whether momentum is fading or simply resetting.
While short-term price action looks undecided, on-chain and volume data suggest buyers may still be quietly in control. The next move depends on whether Zcash can turn consolidation into continuation.
Buyers Still Control Structure Despite Cooling Volume
Zcash price is currently trading inside a tightening triangle pattern, which reflects short-term buyer and seller indecision rather than outright weakness. Importantly, the price continues to respect the rising trend line that has guided the uptrend this cycle. As long as that structure holds, the broader setup remains constructive.
Volume behavior adds key context. Using Wyckoff-style volume color analysis, blue bars indicate buyer-led activity, while yellow and red bars reflect increasing seller control.
Although buyer volume has cooled recently, blue bars are still dominant. A similar slowdown occurred after October 17, when buying pressure briefly weakened, before Zcash went on to rally by more than 300%.
Cooling volume alone did not end that trend. As long as the blue bars dominate, the rally is likely to remain strong, despite any pullbacks.
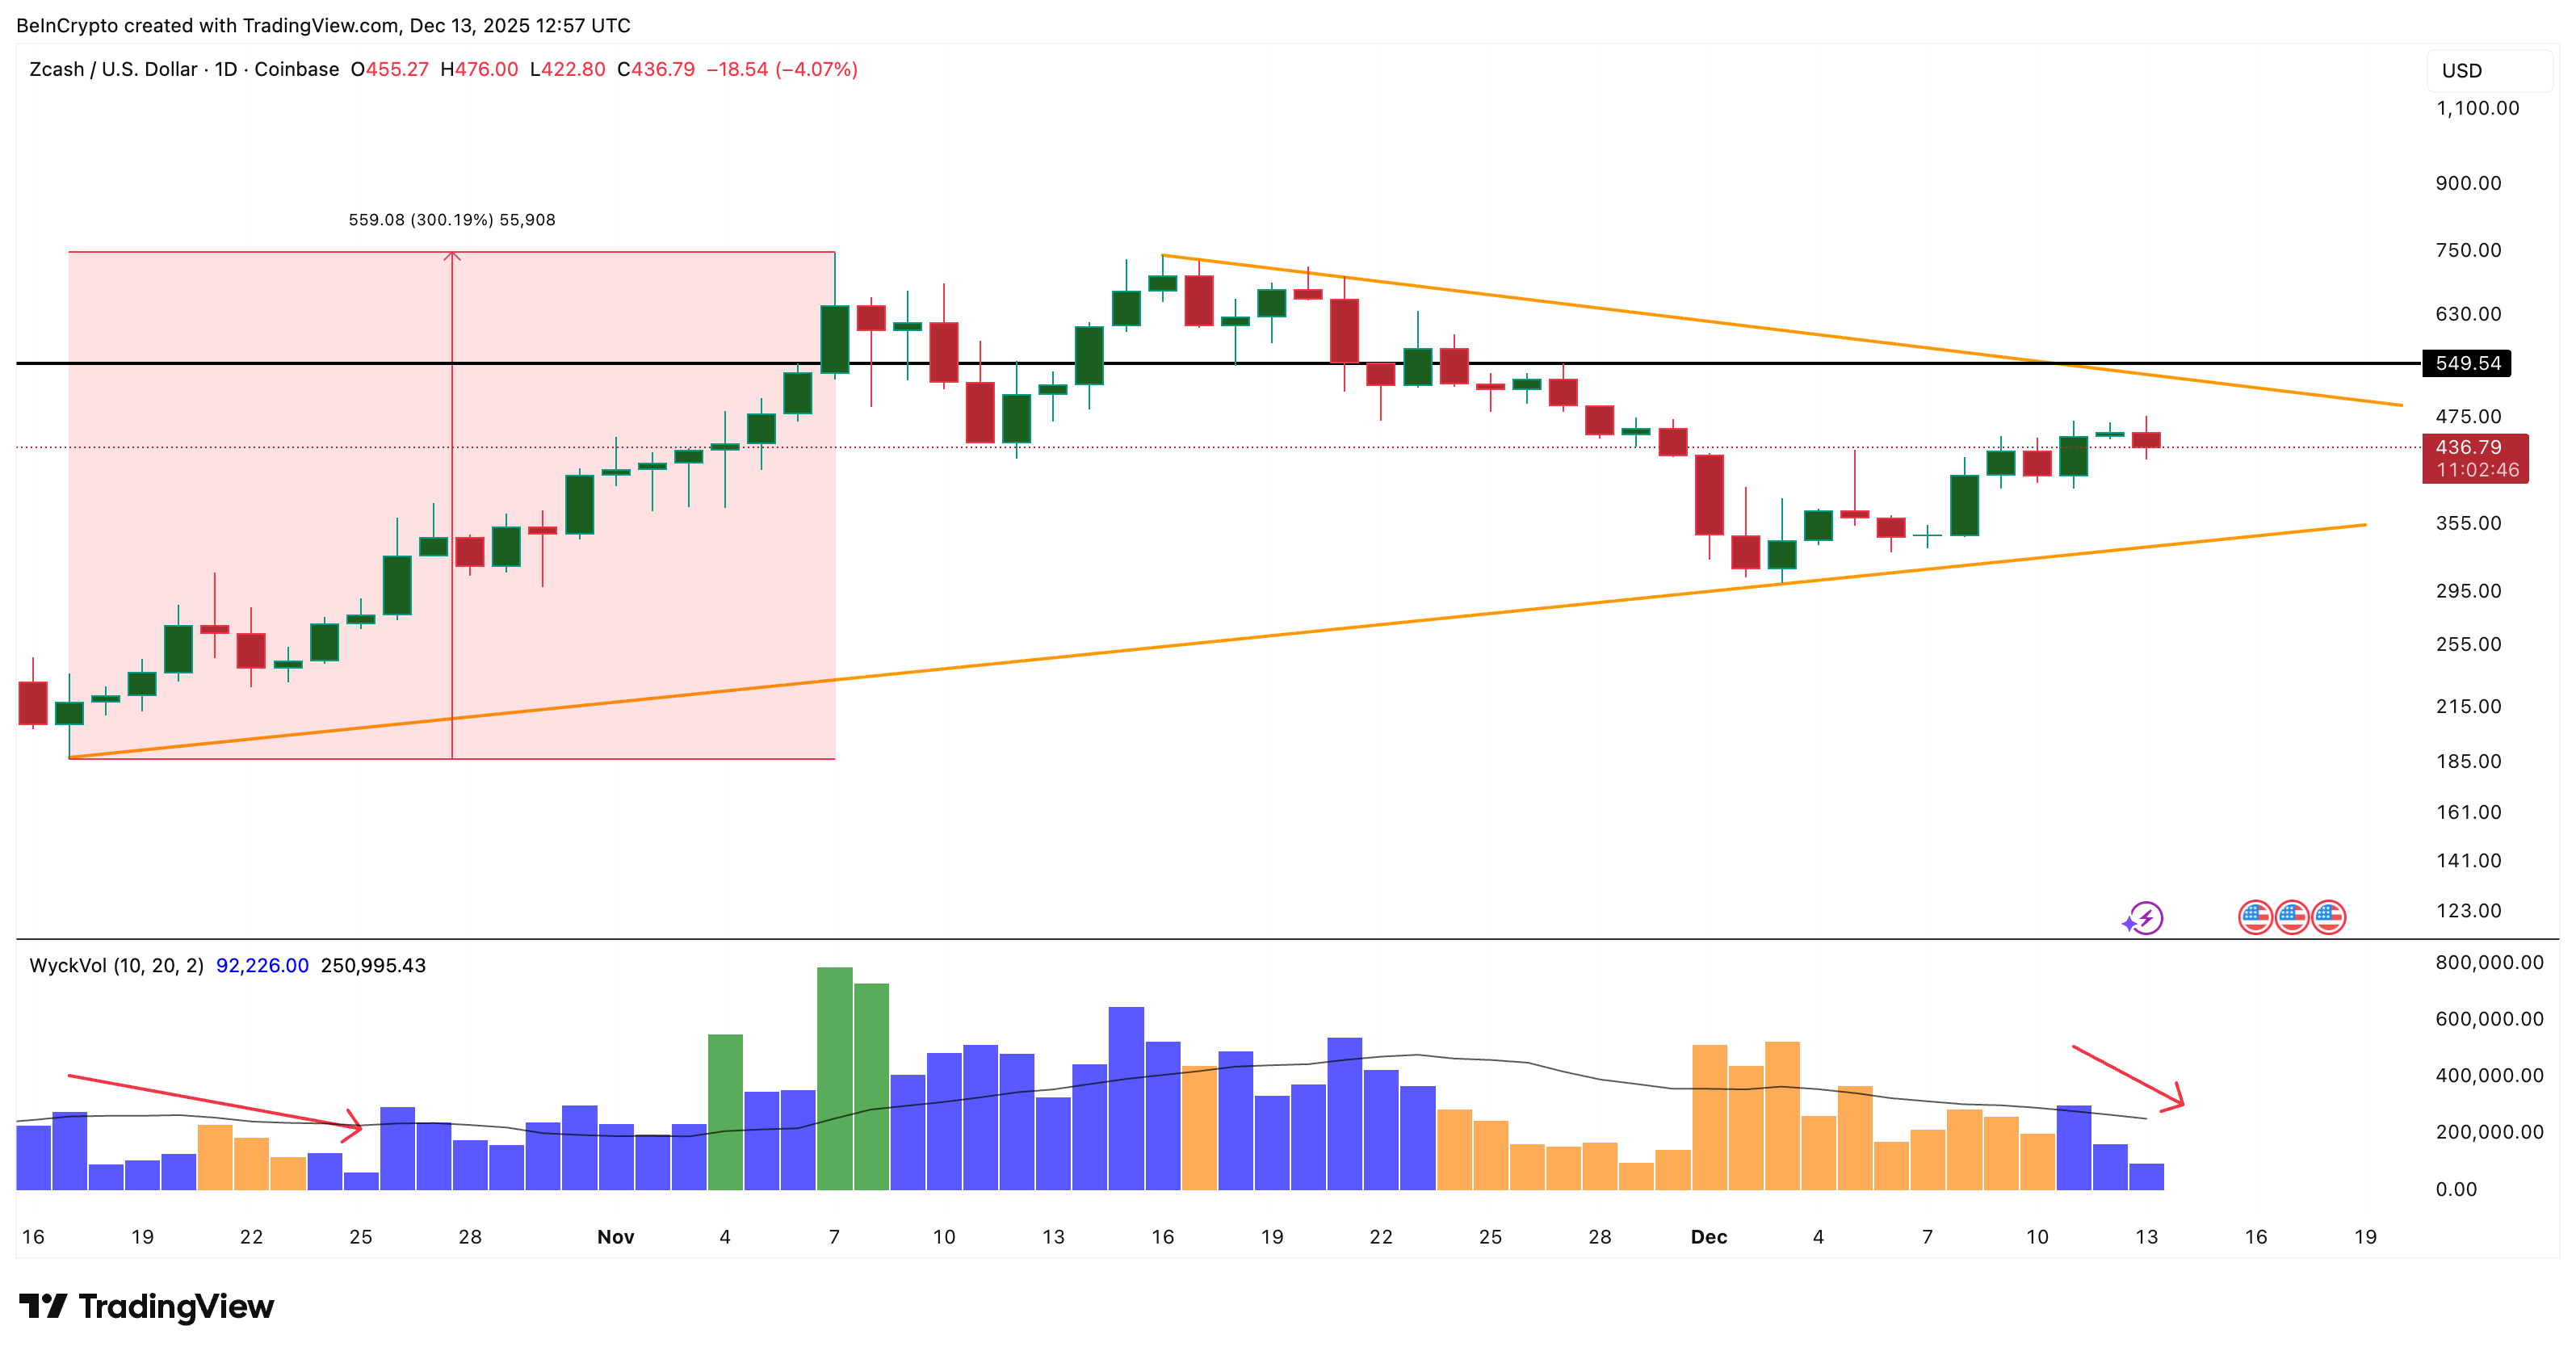 Zcash Buyers In Control: TradingView
Want more token insights like this? Sign up for Editor Harsh Notariya’s Daily Crypto Newsletter here.
Spot flow data reinforces this picture. Spot flows track whether coins are moving onto or off exchanges.
Inflows suggest potential selling, while outflows signal accumulation. On December 12, Zcash recorded roughly $14.26 million in spot inflows, meaning coins moved onto exchanges.
By December 13, that flipped sharply to around $17.34 million in net outflows, showing coins being pulled off exchanges instead.
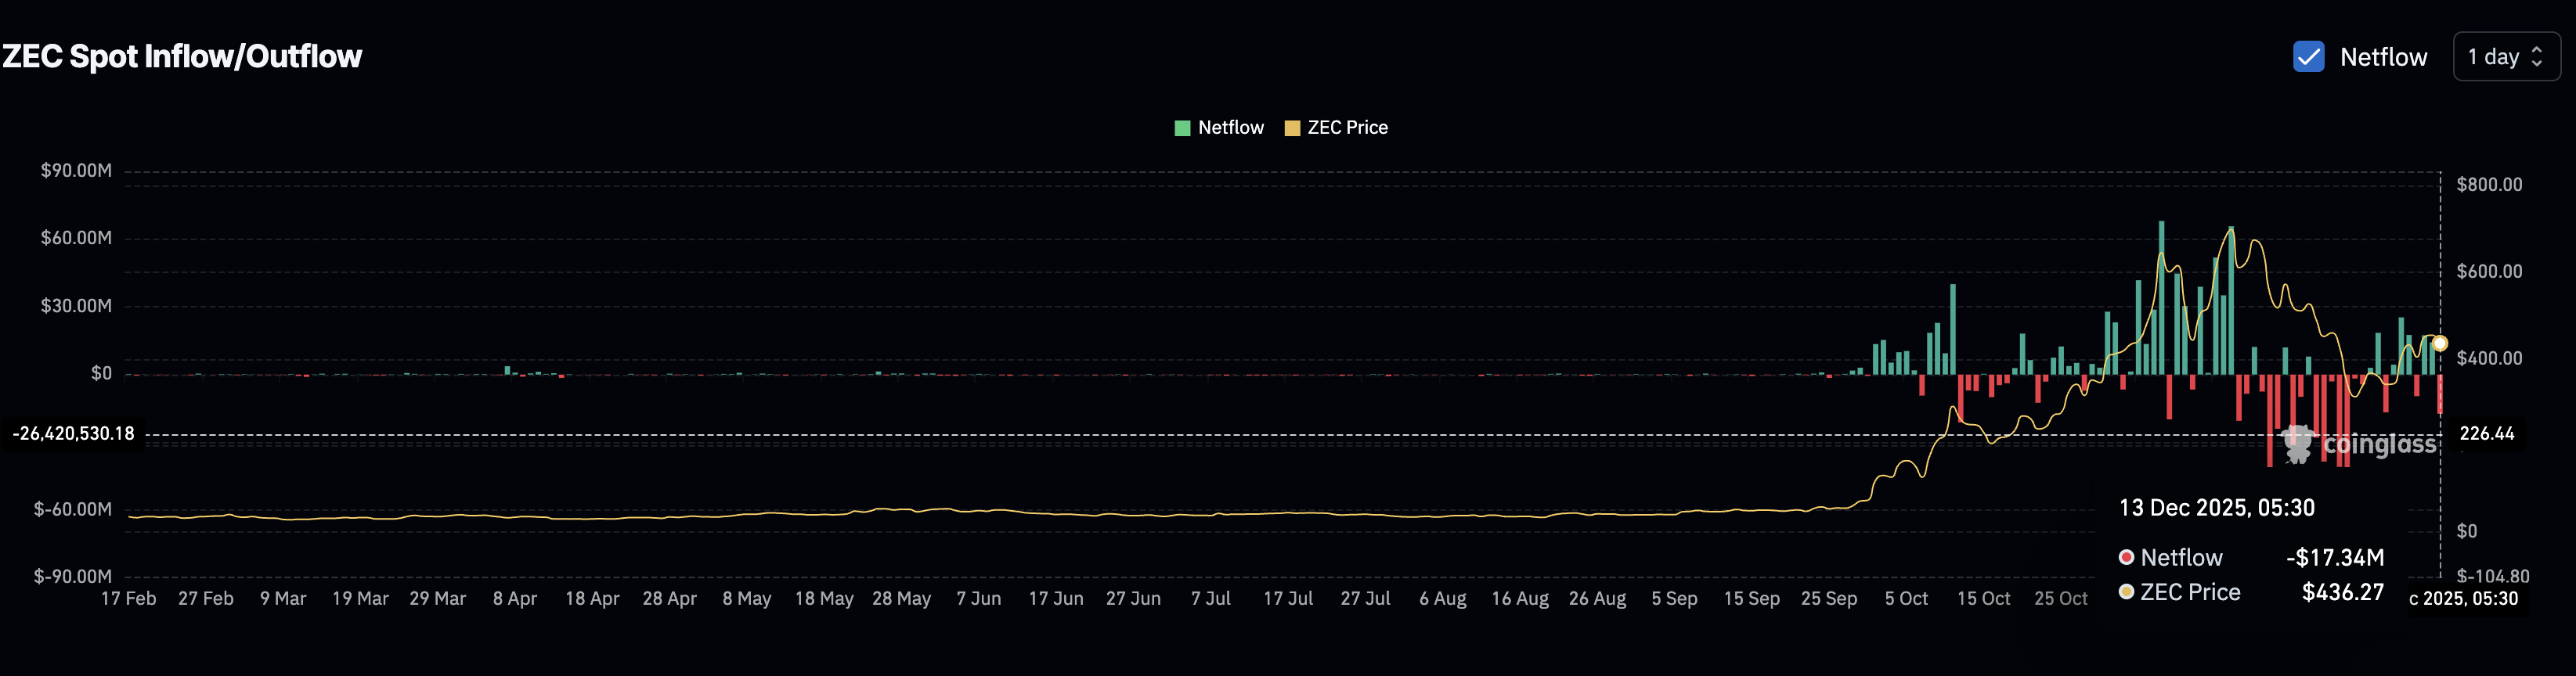 Sudden Surge In Sopt Buyers: Coinglass
That shift matters. Exchange outflows reduce immediate sell pressure and often reflect spot buyers stepping in during pullbacks rather than distributing into strength.
Despite a mild pullback of about 2.5% over the past 24 hours, Zcash remains up roughly 20% over the past week and more than 700% over the past three months. The trend has not broken. It is consolidating.
Zcash Price Levels That Define the Next Move
For the bullish structure to continue, the Zcash price needs to break out of the triangle. The key level to watch is $511, a 24% move from current levels. A clean daily close above this level would confirm a bullish resolution and signal renewed buyer control.
If that breakout occurs, the first upside target sits near $549, followed by $733, which capped rallies earlier in the cycle. Higher resistance zones exist near $850 and $1,190, though reaching those would require sustained momentum and supportive broader market conditions.
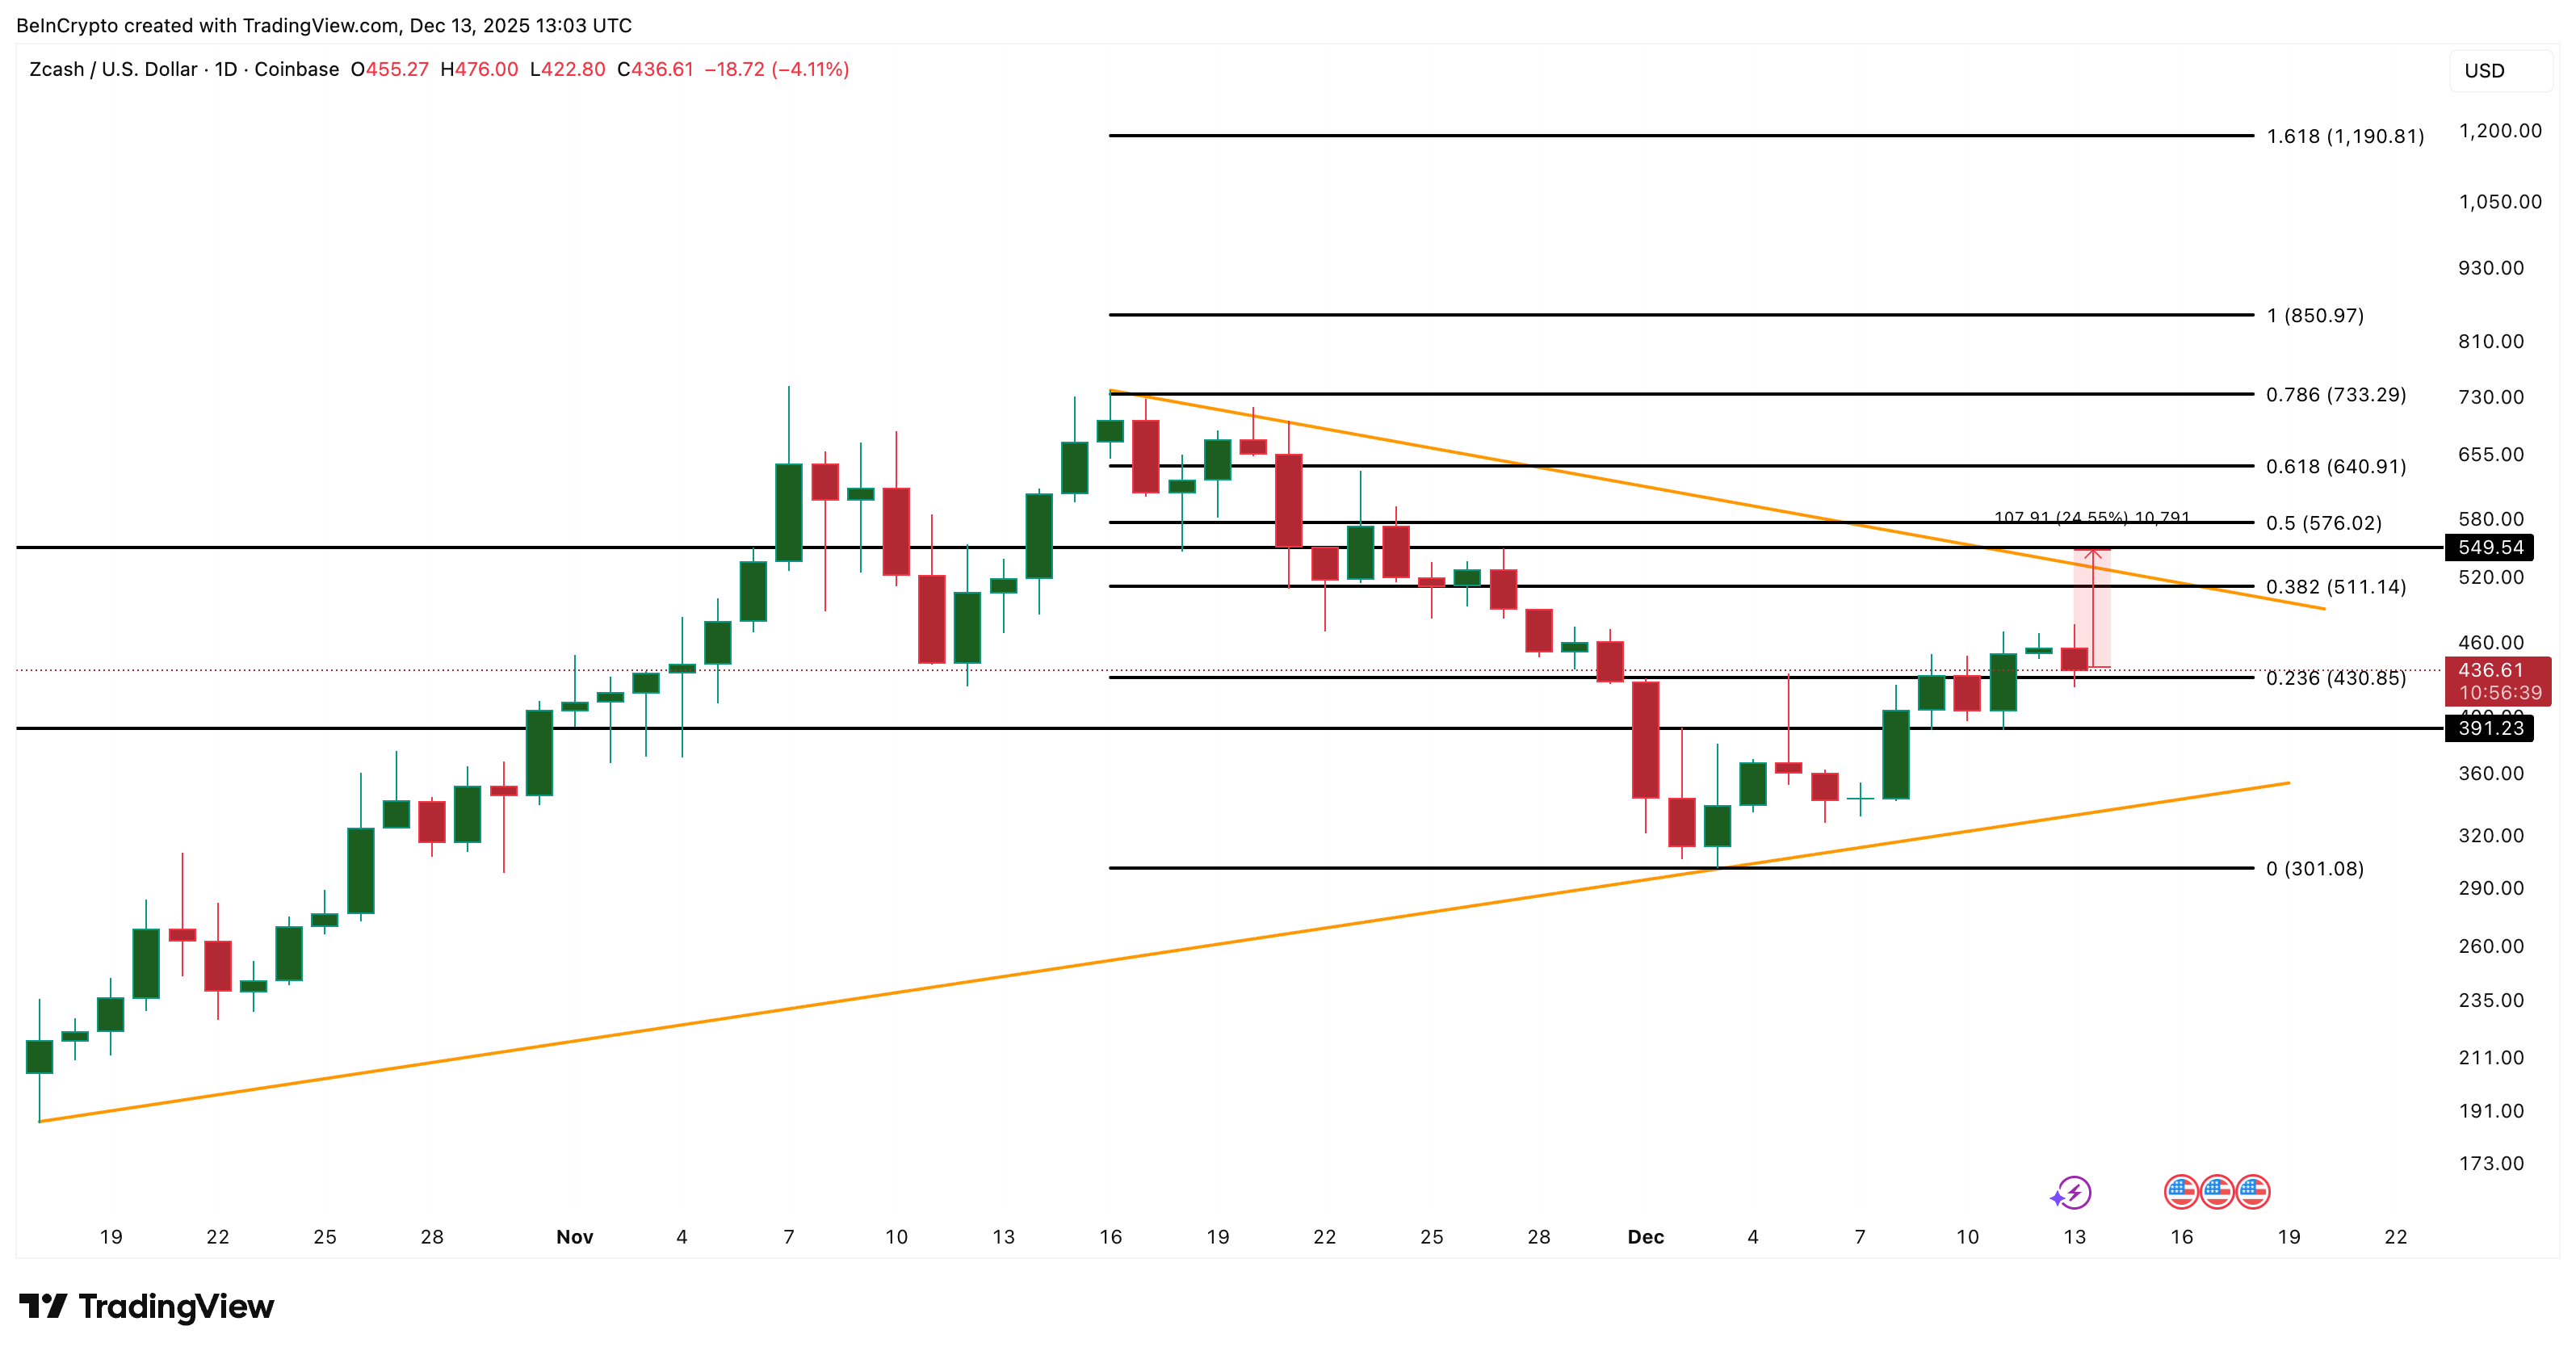 Zcash Price Analysis: TradingView
Downside risk remains clearly defined. If the Zcash price loses $430, the triangle structure weakens. Strong support sits near $391, and a deeper breakdown could open the door to $301 if risk-off pressure spreads across the market.
Ayrıca Şunları da Beğenebilirsiniz

Those Who Missed XRP Now Eye Apeing ($APEING) as One of 2025’s Next Crypto to Hit $1

Polygon Tops RWA Rankings With $1.1B in Tokenized Assets
